划分画布的主要函数(第一部分)–subplot函数
首先引入一个概念:子区:顾名思义就是将画布分成若干个子画布,这些子画布构成绘图区域,在这些 绘图区域上分别绘制图 形,实现一张画布多张图形分区域展示的效果。
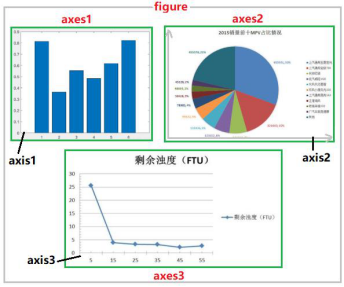
如下图所示:一张画布划分成三个区域,展示三张图形

1. 函数功能
    Add a subplot to the current figure.
    在当前画布中增加子图。
2. 函数语法
subplot(nrows, ncols, index, **kwargs)
subplot(pos, **kwargs)
subplot(**kwargs)
subplot(ax)
3. 函数参数与示例
| 参数 | 含义 |
|---|---|
| (nrows, ncols, index) | 子图的位置;画布被划分成 nrows和ncols;索引 index从左上位置1开始,向右增加;索引index也可以是元组,如(3,1,(1,2))表示画布被划分成3行1列,占据索引位置为1,2的位置;当index的数量小于9可以省略逗号","。即:(3,2,5)可以写为(325) |
| projection | 绘图区域的投影类型;默认rectilinear;{None, ‘aitoff’, ‘hammer’, ‘lambert’, ‘mollweide’, ‘polar’, ‘rectilinear’, str} |
| polar | 布尔值,绘图区域的投影类型;默认取值False;当取值维True时,为极区图;等价于projection=‘polar’ |
| sharex,sharey | 取值为子区,同哪个子区的x或y轴保持一样的边界、刻度 |
3.1 参数(int,int,index)
3.1.1 index为单个数字
import matplotlib.pyplot as plt
import numpy as np
x = np.linspace(-2*np.pi,2*np.pi,1000)
y1 = np.sin(x)
y2 = np.cos(x)
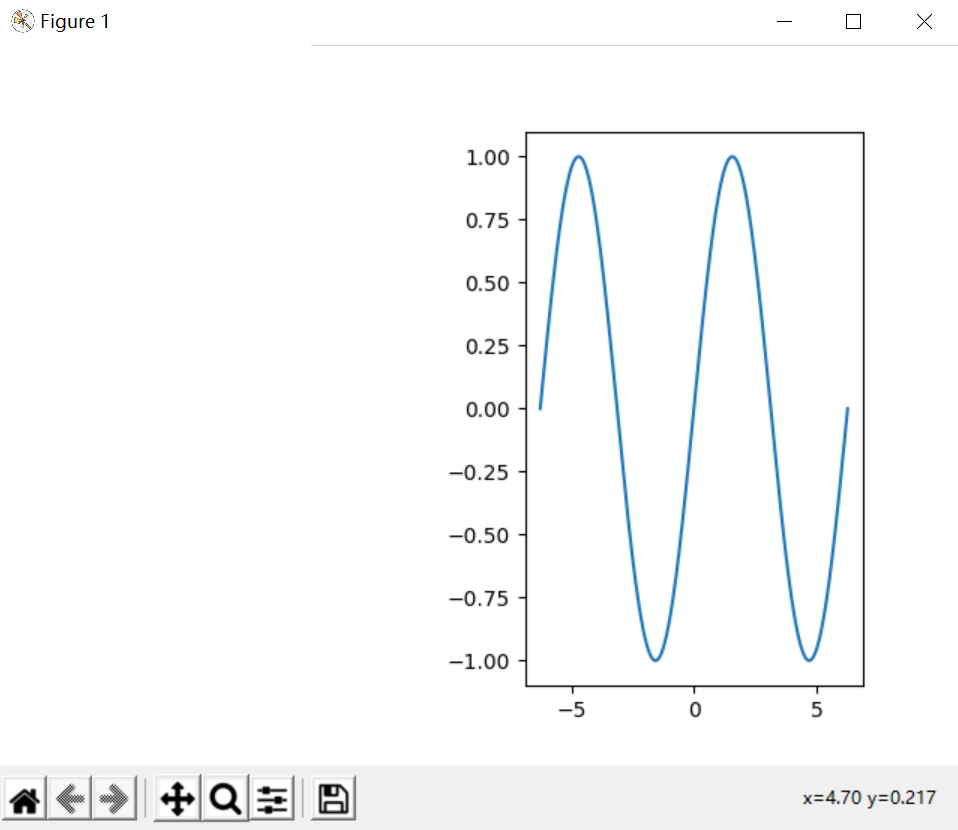
plt.subplot(1,2,2)
plt.plot(x,y1)
plt.show()
3.1.2 索引为元组
import matplotlib.pyplot as plt
import numpy as np

x = np.linspace(-2*np.pi,2*np.pi,1000)
y1 = np.sin(x)
y2 = np.cos(x)

plt.subplot(1,3,(1,2))
plt.plot(x,y1)

plt.show()
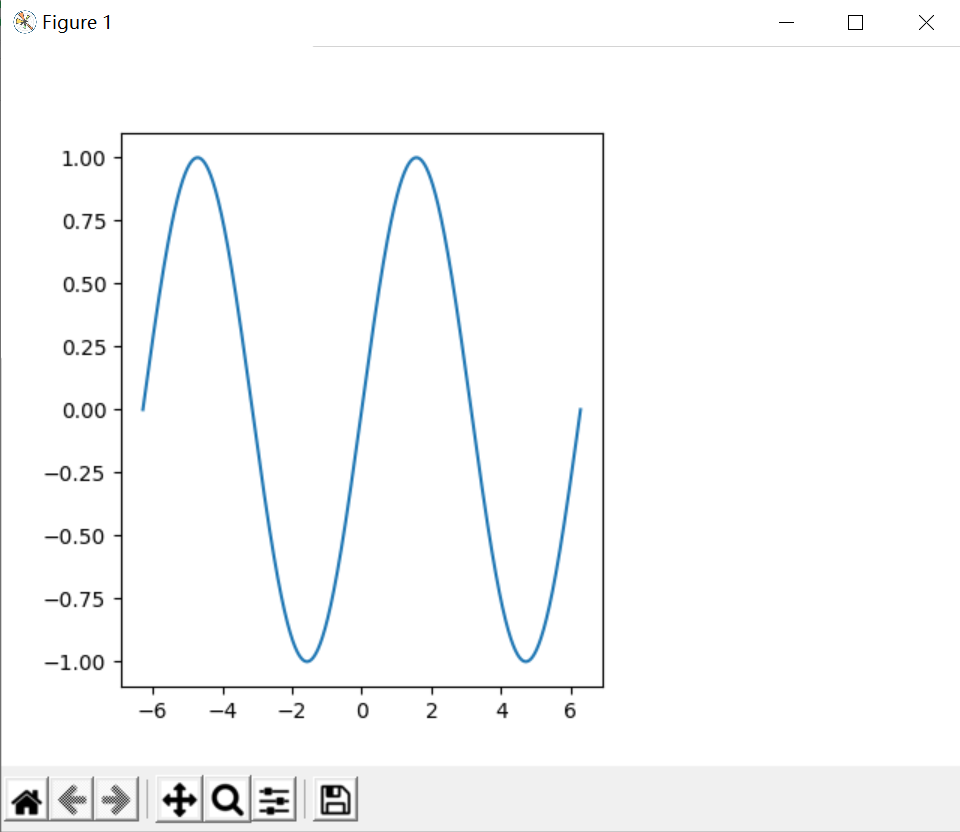
从图中可以看到图形占到整个画布的2/3,是将画布等分成3部分,图形占据1-2两部分。
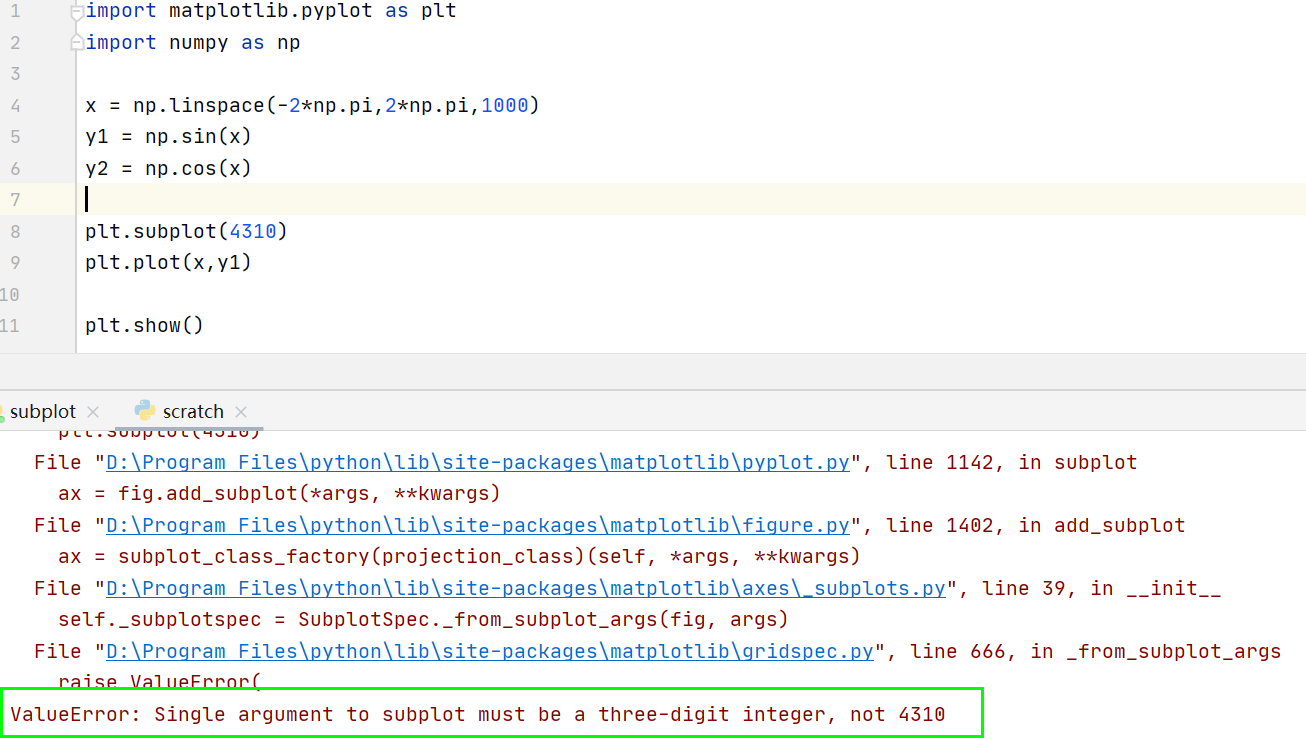
3.1.3 三维整数
该数字会被解读为为三个单位整数分别给出,如(235)与(2,3,5)是一样的,但是需要注意这种方法只能在小于等于9个子图的情况下使用(超过9个子图第三个参数就会变成两位数)如:(4,3,10)只能使用第一种加分割号的方法,而不能使用(4310)
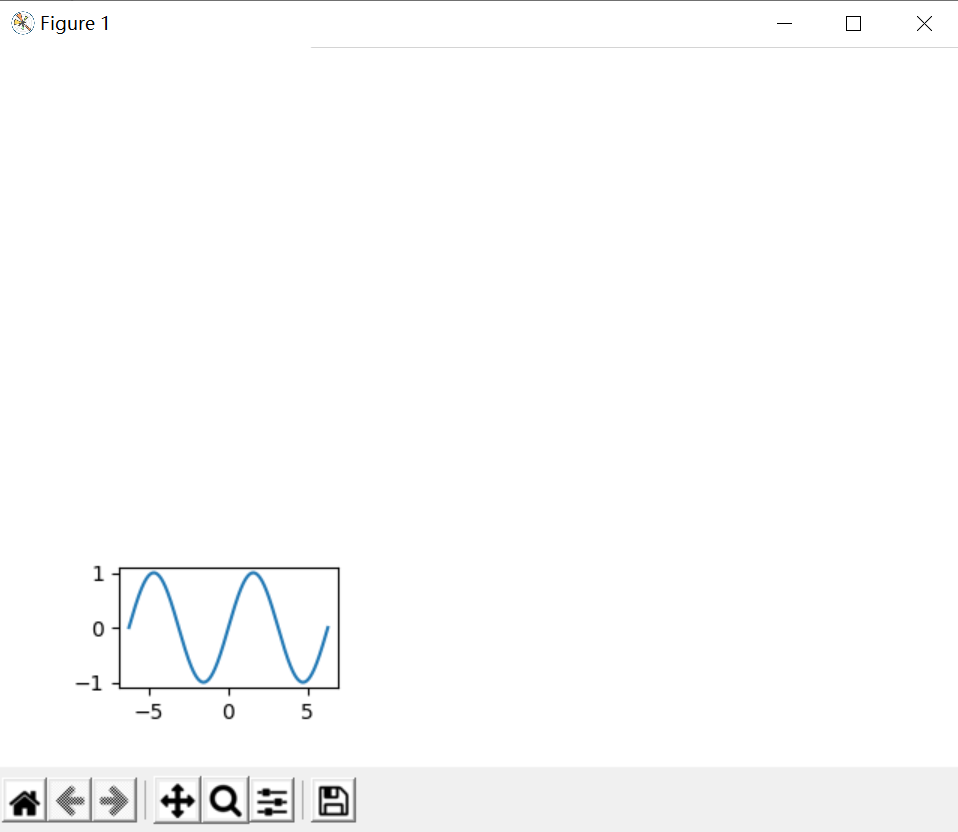
争取使用(4,3,10)的写法
import matplotlib.pyplot as plt
import numpy as np

x = np.linspace(-2*np.pi,2*np.pi,1000)
y1 = np.sin(x)
y2 = np.cos(x)

plt.subplot(4,3,(10))
plt.plot(x,y1)

plt.show()
当使用(4310)
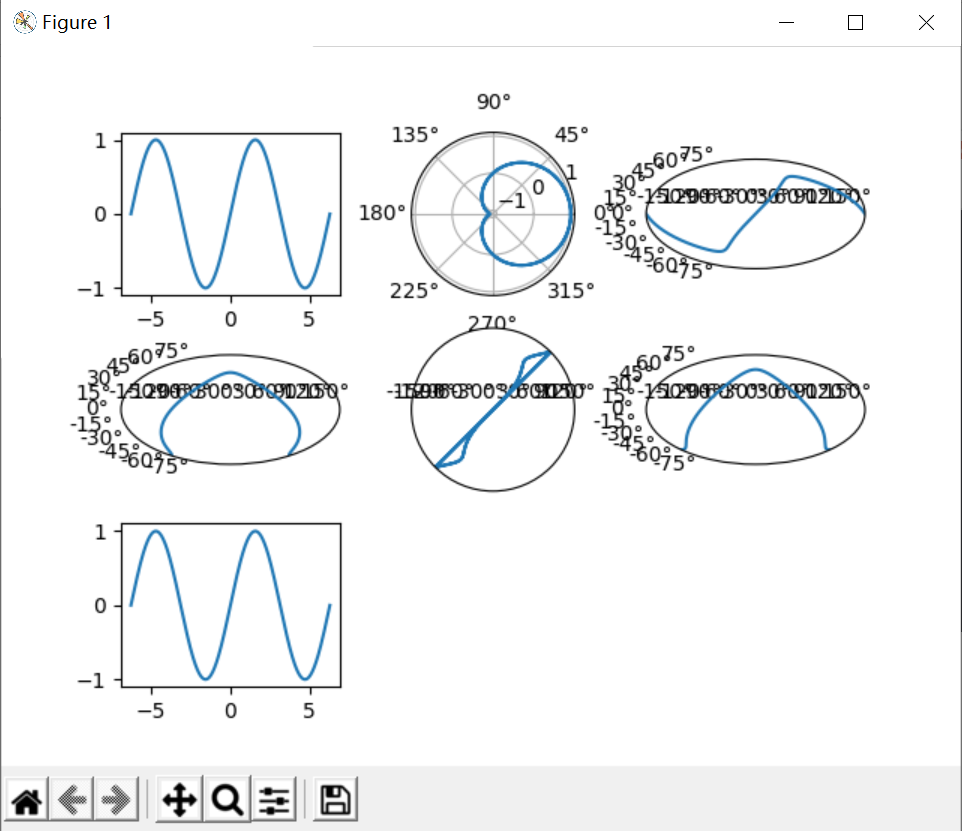
3.2 参数 projection
import matplotlib.pyplot as plt
import numpy as np

x = np.linspace(-2*np.pi,2*np.pi,1000)
y1 = np.sin(x)
y2 = np.cos(x)

plt.subplot(3,3,1,projection=None)
plt.plot(x,y1)

plt.subplot(3,3,2,projection='polar')
plt.plot(x,y2)

plt.subplot(3,3,3,projection='aitoff')
plt.plot(x,y1)

plt.subplot(3,3,4,projection='hammer')
plt.plot(x,y2)

plt.subplot(3,3,5,projection='lambert')
plt.plot(x,y1)

plt.subplot(3,3,6,projection='mollweide')
plt.plot(x,y2)

plt.subplot(3,3,7,projection='rectilinear')
plt.plot(x,y1)

plt.show()
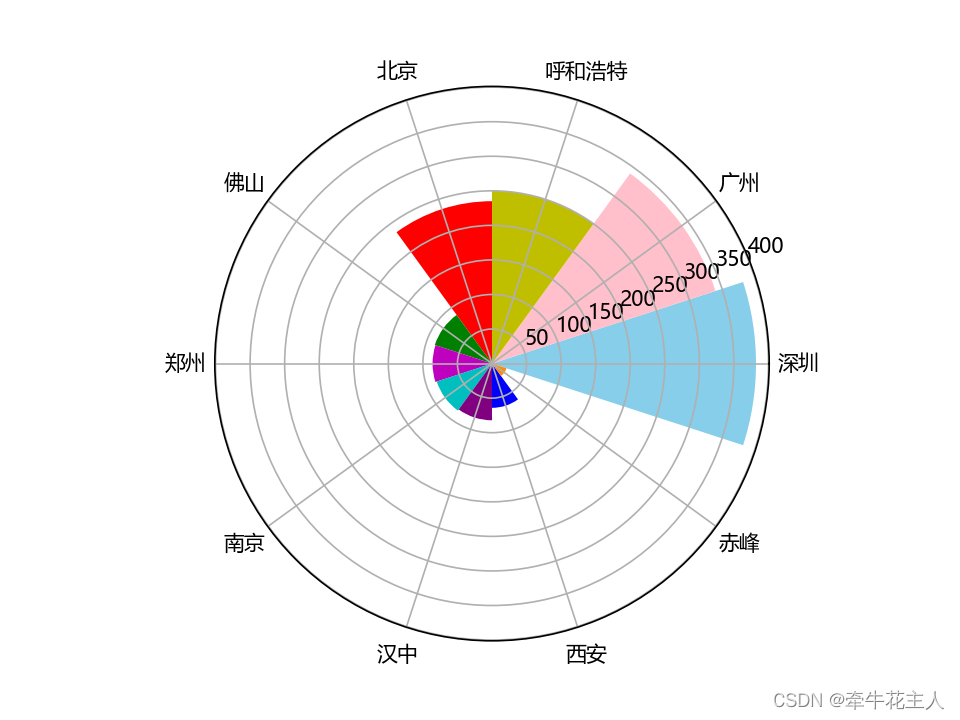
3.3 参数 polar
'''
import matplotlib.pyplot as plt
import numpy as np
import matplotlib as mpl

mpl.rcParams['font.sans-serif'] = ['KaiTi']
mpl.rcParams['axes.unicode_minus'] = False

x = np.linspace(0, 2 * np.pi, 500)
y1 = np.sin(x) * np.cos(x)
y2 = np.exp(-x)
y3 = np.sqrt(x)
y4 = x / 4

fig, ax = plt.subplots(4, 1, facecolor='beige', sharex=True,
                       subplot_kw=dict(facecolor='seashell'))

fig.subplots_adjust(left=0.05, right=0.98, bottom=0.05,
                    top=0.95, hspace=0)

ax[0].plot(x, y1, c='r', lw=2)
ax[1].plot(x, y2, c='y', ls="--")
ax[2].plot(x, y3, c='g', ls=":")
ax[3].plot(x, y4, c='m', ls='-.', lw=2)

plt.show()
'''

import numpy as np
import matplotlib.pyplot as plt
import matplotlib as mpl

plt.rcParams['font.sans-serif'] = ['Microsoft YaHei']

a = np.linspace(0, 2.0 * np.pi, 10, endpoint=False)
b = [382, 340, 250, 235, 87, 86, 84, 82, 64, 22]
city = ['深圳', '广州', '呼和浩特', '北京', '佛山', '郑州', '南京', '汉中', '西安', '赤峰']
plt.subplot(111, polar=True)
plt.bar(a, b, width=0.2 * np.pi, tick_label=city,
        color=['skyblue', 'pink', 'y', 'r', 'g', 'm', 'c', 'purple', 'b', 'darkorange'])

plt.show()
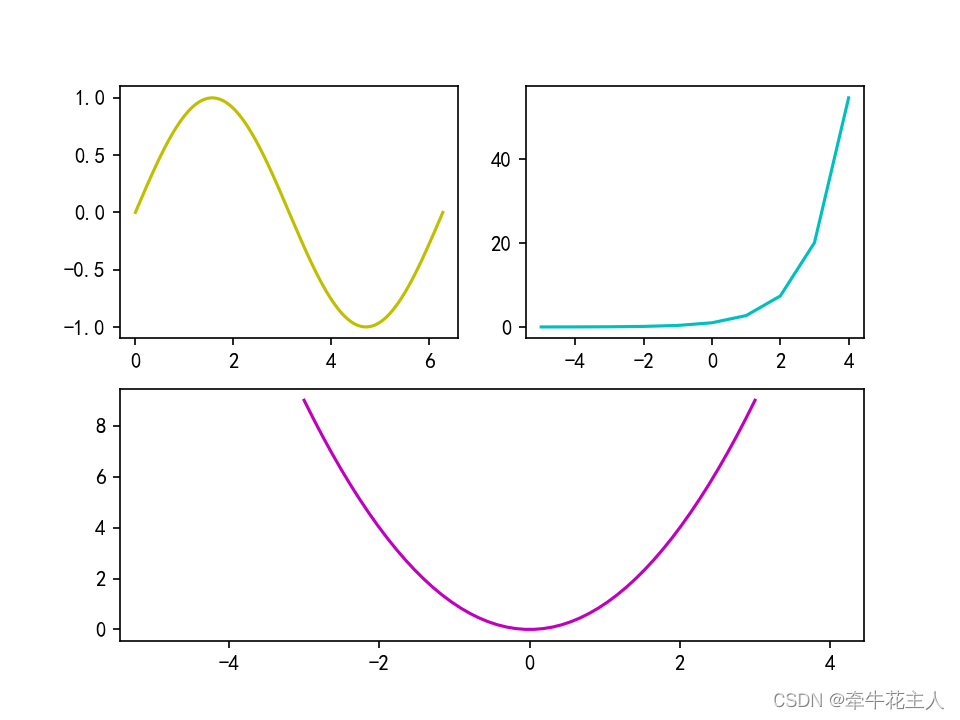
3.4 参数 sharex、sharey
'''
import matplotlib.pyplot as plt
import numpy as np
import matplotlib as mpl

mpl.rcParams['font.sans-serif'] = ['KaiTi']
mpl.rcParams['axes.unicode_minus'] = False

x = np.linspace(0, 2 * np.pi, 500)
y1 = np.sin(x) * np.cos(x)
y2 = np.exp(-x)
y3 = np.sqrt(x)
y4 = x / 4

fig, ax = plt.subplots(4, 1, facecolor='beige', sharex=True,
                       subplot_kw=dict(facecolor='seashell'))

fig.subplots_adjust(left=0.05, right=0.98, bottom=0.05,
                    top=0.95, hspace=0)

ax[0].plot(x, y1, c='r', lw=2)
ax[1].plot(x, y2, c='y', ls="--")
ax[2].plot(x, y3, c='g', ls=":")
ax[3].plot(x, y4, c='m', ls='-.', lw=2)

plt.show()
'''

import matplotlib.pyplot as plt
import numpy as np
import matplotlib as mpl

mpl.rcParams['font.sans-serif'] = ['KaiTi']
mpl.rcParams['axes.unicode_minus'] = False

x1 = np.linspace(0, 2 * np.pi, 500)
y1 = np.sin(x1)
x2 = np.arange(-5, 5)
y2 = np.exp(x2)
x3 = np.linspace(-3, 3)
y3 = np.power(x3, 2)

plt.subplot(221)
plt.plot(x1, y1, c='y')
ax2 = plt.subplot(222)
plt.plot(x2, y2, c='c')
plt.subplot(2, 2, (3, 4), sharex=ax2)
plt.plot(x3, y3, c='m')

plt.show()
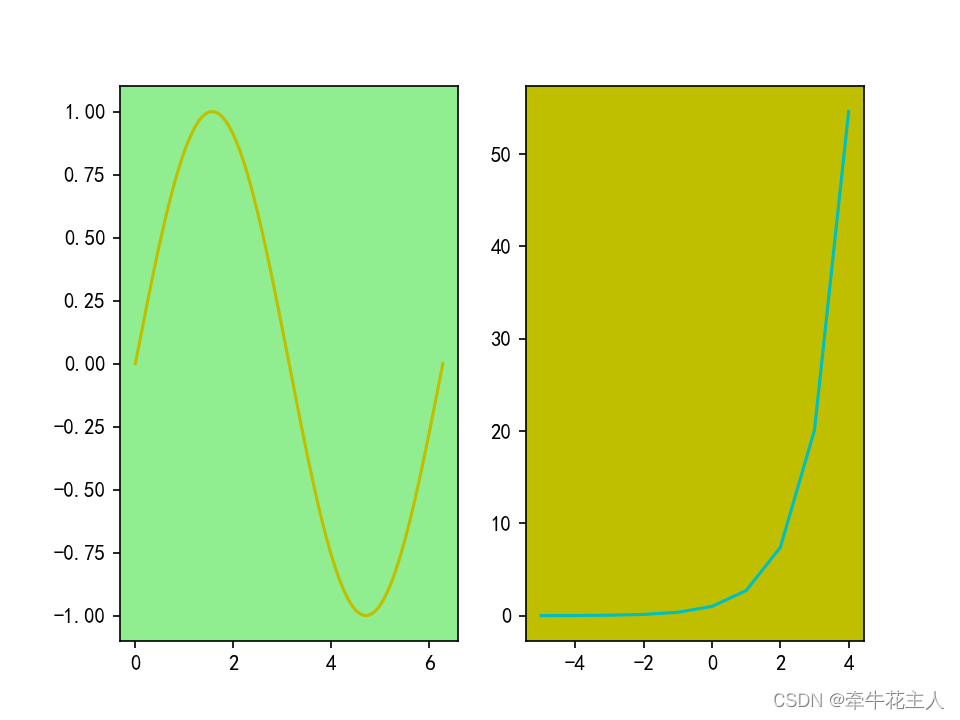
3.5 其他参数
'''
import matplotlib.pyplot as plt
import numpy as np
import matplotlib as mpl

mpl.rcParams['font.sans-serif'] = ['KaiTi']
mpl.rcParams['axes.unicode_minus'] = False

x = np.linspace(0, 2 * np.pi, 500)
y1 = np.sin(x) * np.cos(x)
y2 = np.exp(-x)
y3 = np.sqrt(x)
y4 = x / 4

fig, ax = plt.subplots(4, 1, facecolor='beige', sharex=True,
                       subplot_kw=dict(facecolor='seashell'))

fig.subplots_adjust(left=0.05, right=0.98, bottom=0.05,
                    top=0.95, hspace=0)

ax[0].plot(x, y1, c='r', lw=2)
ax[1].plot(x, y2, c='y', ls="--")
ax[2].plot(x, y3, c='g', ls=":")
ax[3].plot(x, y4, c='m', ls='-.', lw=2)

plt.show()
'''

import matplotlib.pyplot as plt
import numpy as np
import matplotlib as mpl

mpl.rcParams['font.sans-serif'] = ['KaiTi']
mpl.rcParams['axes.unicode_minus'] = False

x1 = np.linspace(0, 2 * np.pi, 500)
y1 = np.sin(x1)
x2 = np.arange(-5, 5)
y2 = np.exp(x2)


plt.subplot(121, facecolor='lightgreen')
plt.plot(x1, y1, c='y')
ax2 = plt.subplot(122, facecolor='y')
plt.plot(x2, y2, c='c')

plt.show()
4. 返回值
返回值的类型取决于projection参数指定的投影类型,当projection=rectilinear 时,返回axes
官方文档subplot
最后
以上就是文艺背包最近收集整理的关于subplot()函数--Matplotlib1. 函数功能2. 函数语法3. 函数参数与示例4. 返回值的全部内容,更多相关subplot()函数--Matplotlib1.内容请搜索靠谱客的其他文章。
本图文内容来源于网友提供,作为学习参考使用,或来自网络收集整理,版权属于原作者所有。


发表评论 取消回复