Python+matplotlib进行鼠标交互,实现动态标注,数据可视化显示,鼠标划过时画一条竖线并使用标签来显示当前值。
Python3.6.5,代码示例:
import matplotlib.pyplot as plt
import numpy as np
def Show(y):
#参数为一个list
len_y = len(y)
x = range(len_y)
_y = [y[-1]]*len_y

fig = plt.figure(figsize=(960/72,360/72))
ax1 = fig.add_subplot(1,1,1)

ax1.plot(x, y, color='blue')
line_x = ax1.plot(x, _y, color='skyblue')[0]
line_y = ax1.axvline(x=len_y-1, color='skyblue')

ax1.set_title('aaa')
#标签
text0 = plt.text(len_y-1,y[-1],str(y[-1]),fontsize = 10)

def scroll(event):
	axtemp=event.inaxes
	x_min, x_max = axtemp.get_xlim()
	fanwei_x = (x_max - x_min) / 10
	if event.button == 'up':
		axtemp.set(xlim=(x_min + fanwei_x, x_max - fanwei_x))
	elif event.button == 'down':
		axtemp.set(xlim=(x_min - fanwei_x, x_max + fanwei_x))
	fig.canvas.draw_idle()
#这个函数实时更新图片的显示内容
def motion(event):
	try:
		temp = y[int(np.round(event.xdata))]
		for i in range(len_y):
			_y[i] = temp
		line_x.set_ydata(_y)
		line_y.set_xdata(event.xdata)
		######
		text0.set_position((event.xdata, temp))
		text0.set_text(str(temp))

		fig.canvas.draw_idle() # 绘图动作实时反映在图像上
	except:
		pass

fig.canvas.mpl_connect('scroll_event', scroll)
fig.canvas.mpl_connect('motion_notify_event', motion)

plt.show()
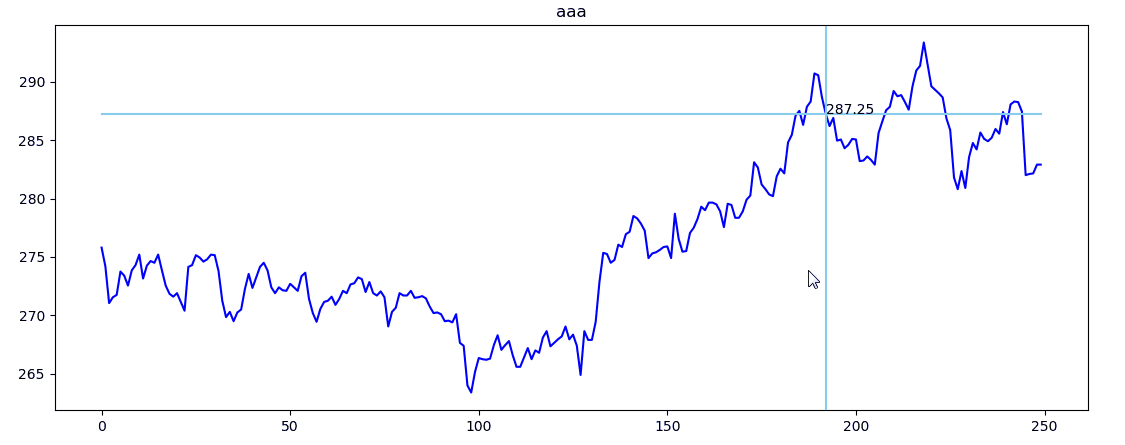
效果演示:
转载请注明出处:https://blog.csdn.net/qq_38778838/article/details/89040722
最后
以上就是刻苦小刺猬最近收集整理的关于python中matplotlib实现随鼠标滑动自动标注的全部内容,更多相关python中matplotlib实现随鼠标滑动自动标注内容请搜索靠谱客的其他文章。
本图文内容来源于网友提供,作为学习参考使用,或来自网络收集整理,版权属于原作者所有。


发表评论 取消回复