1 Hystrix Dashboard
Hystrix Dashboard 是 Hystrix 的一个组件,它提供了一个断路器的监控面板可以帮助我们更好地监控服务和集群状态,需要注意的是,仅仅使用 Hystrix Dashboard 我们只能监控到单个断路器的状态,在实际开发中,还需要结合 Turbine 来使用。
2 Hystrix Dashboard 实战
话不多说,我们直接来尝试使用 Hystrix Dashboard 。本项目需在上一篇博客 EurekaConsumer 基础上实现。
2.1 添加依赖
		<dependency>
            <groupId>org.springframework.cloud</groupId>
            <artifactId>spring-cloud-starter-netflix-hystrix</artifactId>
        </dependency>

        <dependency>
			<groupId>org.springframework.cloud</groupId>
			<artifactId>spring-cloud-starter-netflix-hystrix-dashboard</artifactId>
		</dependency>

		<dependency>
			<groupId>org.springframework.boot</groupId>
			<artifactId>spring-boot-starter-actuator</artifactId>
		</dependency>
2.2 添加注解
然后我们在启动类上添加注解 @EnableHystrixDashboard 和 @EnableCircuitBreaker,@EnableCircuitBreaker 注解表示开启断路器,@EnableHystrixDashboard 注解用于开启 Dashboard。接下来,我们还需要在启动类上添加一行配置。
	@Bean
	public ServletRegistrationBean getServlet() {
		HystrixMetricsStreamServlet streamServlet = new HystrixMetricsStreamServlet();
		ServletRegistrationBean registrationBean = new ServletRegistrationBean(streamServlet);
		registrationBean.setLoadOnStartup(1);
		registrationBean.addUrlMappings("/actuator/hystrix.stream");
		registrationBean.setName("HystrixMetricsStreamServlet");
		return registrationBean;
	}
综上所述,我们的启动类长这样
package com.example.EurekaConsumer;

import org.springframework.boot.SpringApplication;
import org.springframework.boot.autoconfigure.SpringBootApplication;
import org.springframework.boot.web.servlet.ServletRegistrationBean;
import org.springframework.cloud.client.circuitbreaker.EnableCircuitBreaker;
import org.springframework.cloud.client.discovery.EnableDiscoveryClient;
import org.springframework.cloud.netflix.hystrix.dashboard.EnableHystrixDashboard;
import org.springframework.cloud.openfeign.EnableFeignClients;
import org.springframework.context.annotation.Bean;

import com.netflix.hystrix.contrib.metrics.eventstream.HystrixMetricsStreamServlet;

@SpringBootApplication
@EnableDiscoveryClient
@EnableFeignClients
@EnableHystrixDashboard
@EnableCircuitBreaker
public class EurekaConsumerApplication {

	public static void main(String[] args) {
		SpringApplication.run(EurekaConsumerApplication.class, args);
	}

	@Bean
	public ServletRegistrationBean getServlet() {
		HystrixMetricsStreamServlet streamServlet = new HystrixMetricsStreamServlet();
		ServletRegistrationBean registrationBean = new ServletRegistrationBean(streamServlet);
		registrationBean.setLoadOnStartup(1);
		registrationBean.addUrlMappings("/actuator/hystrix.stream");
		registrationBean.setName("HystrixMetricsStreamServlet");
		return registrationBean;
	}

}
3 Hystrix Dashboard 测试
启动工程,访问 http://localhost:8082/hystrix,会看到以下界面
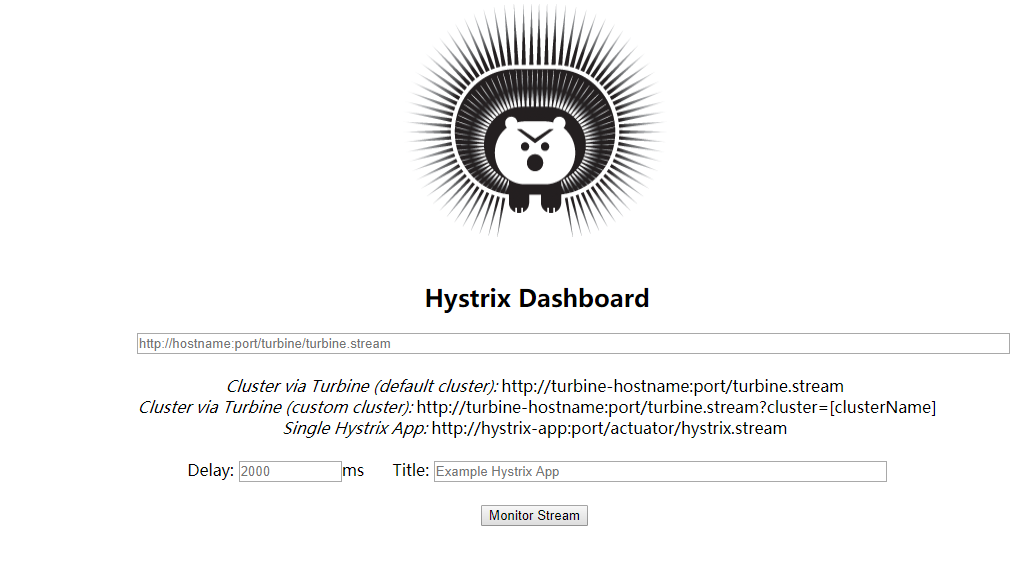
我们看这里
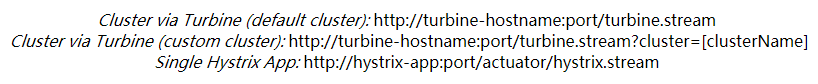
数据源共有三种,第一种监控所有集群,第二种监控指定集群,第三种监控单个应用。
我们选择第三个,输入 http://localhost:8082/actuator/hystrix.stream
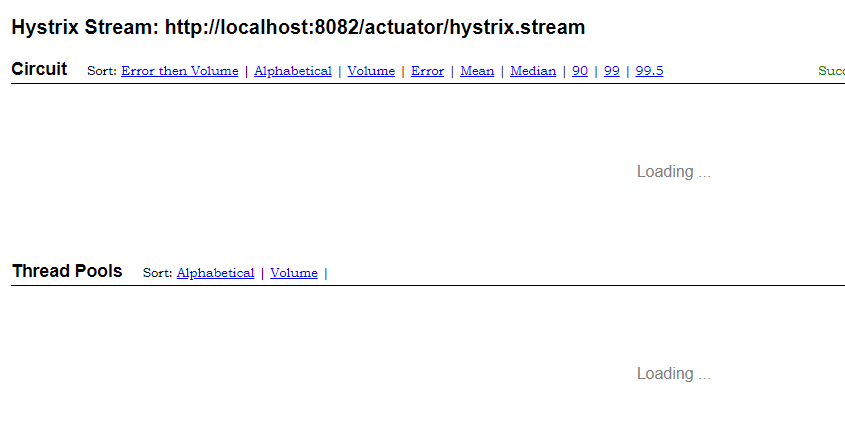
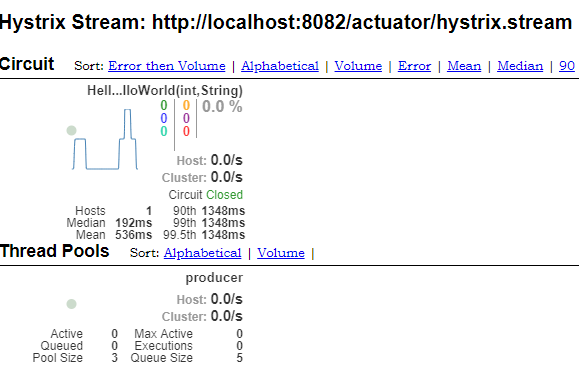
现在处于 loading 状态,是因为没有数据,我们随便调用一下服务,便可加载数据了。
4 什么是 Turbine?
经过之前的学习,相信大家都明白了 Hystrix Dashboard 只能查看单个微服务的情况,但是一般项目中是微服务是以集群的形式搭建,一个一个的监控不现实。那如果我们想要达到集群监控的效果,又应该怎么做呢?
Turbine 通过建立一个 turbine 服务并注册到 eureka 中并发现 eureka 上的 hystrix 服务,把多个 /hystrix.stream 聚合在 /turbine.stream 中,来监控聚合系统的所有集群的状态。
5 Turbine 实战
我们新建一个项目,命名为 Turbine。
5.1 pom.xml
<?xml version="1.0" encoding="UTF-8"?>
<project xmlns="http://maven.apache.org/POM/4.0.0" xmlns:xsi="http://www.w3.org/2001/XMLSchema-instance"
	xsi:schemaLocation="http://maven.apache.org/POM/4.0.0 https://maven.apache.org/xsd/maven-4.0.0.xsd">
	<modelVersion>4.0.0</modelVersion>
	<parent>
		<groupId>org.springframework.boot</groupId>
		<artifactId>spring-boot-starter-parent</artifactId>
		<version>2.1.1.RELEASE</version>
		<relativePath/>
	</parent>
	<groupId>com.example</groupId>
	<artifactId>Turbine</artifactId>
	<version>0.0.1-SNAPSHOT</version>
	<name>Turbine</name>
	<description>Demo project for Spring Boot</description>

	<properties>
		<java.version>1.8</java.version>
	</properties>

	<dependencies>

		<dependency>
  			<groupId>org.springframework.cloud</groupId>
  			<artifactId>spring-cloud-starter-netflix-eureka-client</artifactId>
		</dependency>

		<dependency>
    		<groupId>org.springframework.cloud</groupId>
    		<artifactId>spring-cloud-starter-netflix-turbine</artifactId>
		</dependency>

		<dependency>
            <groupId>org.springframework.cloud</groupId>
            <artifactId>spring-cloud-starter-netflix-hystrix</artifactId>
        </dependency>

        <dependency>
			<groupId>org.springframework.cloud</groupId>
			<artifactId>spring-cloud-starter-netflix-hystrix-dashboard</artifactId>
		</dependency>

		<dependency>
			<groupId>org.springframework.boot</groupId>
			<artifactId>spring-boot-starter-actuator</artifactId>
		</dependency>

		<dependency>
			<groupId>org.springframework.boot</groupId>
			<artifactId>spring-boot-starter</artifactId>
		</dependency>

		<dependency>
			<groupId>org.springframework.boot</groupId>
			<artifactId>spring-boot-starter-test</artifactId>
			<scope>test</scope>
		</dependency>

		<dependency>
            <groupId>javax.xml.bind</groupId>
            <artifactId>jaxb-api</artifactId>
        </dependency>
        <dependency>
            <groupId>com.sun.xml.bind</groupId>
            <artifactId>jaxb-impl</artifactId>
            <version>2.3.0</version>
        </dependency>
        <dependency>
            <groupId>org.glassfish.jaxb</groupId>
            <artifactId>jaxb-runtime</artifactId>
        </dependency>
        <dependency>
            <groupId>javax.activation</groupId>
            <artifactId>activation</artifactId>
            <version>1.1.1</version>
        </dependency>
	</dependencies>

	<dependencyManagement>
  		<dependencies>
    		<dependency>
      			<groupId>org.springframework.cloud</groupId>
      			<artifactId>spring-cloud-dependencies</artifactId>
      			<version>Finchley.SR2</version>
      			<type>pom</type>
      			<scope>import</scope>
   			 </dependency>
  		</dependencies>
	</dependencyManagement>

	<build>
		<plugins>
			<plugin>
				<groupId>org.springframework.boot</groupId>
				<artifactId>spring-boot-maven-plugin</artifactId>
			</plugin>
		</plugins>
	</build>

</project>
5.2 配置文件
spring.application.name=turbine
server.port=8084
eureka.client.serviceUrl.defaultZone=http://localhost:8761/eureka/

# turbine配置
# 需要监控的应用名称,默认逗号隔开
turbine.app-config=consumer
# 集群名称
turbine.cluster-name-expression="default"
5.3 启动类
package com.example.Turbine;

import org.springframework.boot.SpringApplication;
import org.springframework.boot.autoconfigure.SpringBootApplication;
import org.springframework.cloud.client.discovery.EnableDiscoveryClient;
import org.springframework.cloud.netflix.hystrix.dashboard.EnableHystrixDashboard;
import org.springframework.cloud.netflix.turbine.EnableTurbine;

@SpringBootApplication
@EnableTurbine
@EnableDiscoveryClient
@EnableHystrixDashboard
public class TurbineApplication {

	public static void main(String[] args) {
		SpringApplication.run(TurbineApplication.class, args);
	}

}
@EnableTurbine 注解提供对 Turbine 的支持。
6 Turbine 测试
我们访问 http://localhost:8084/turbine.stream,发现其返回如下
: ping
data: {"reportingHostsLast10Seconds":2,"name":"meta","type":"meta","timestamp":1572339801630}
它会不断刷新以获取实时的监控数据,返回监控项目的信息。我们进入其图形化界面,输入 http://localhost:8084/hystrix,然后输入 http://localhost:8084/turbine.stream,我们可观测到如下界面
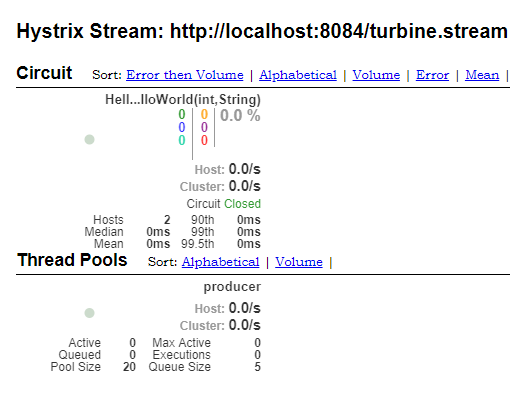
证明我们的 Turbine 集成成功。
参考:springcloud(五):熔断监控Hystrix Dashboard和Turbine
SpringCloud断路器监控面板——Hystrix Dashboard
白话SpringCloud | 第六章:Hystrix监控面板及数据聚合(Turbine)
最后
以上就是想人陪蜗牛最近收集整理的关于Spring Cloud 入门系列六 -- 断路器监控面板 Hystrix Dashboard 和断路器聚合监控 Turbine的全部内容,更多相关Spring内容请搜索靠谱客的其他文章。


发表评论 取消回复