二维图
dt = 1000;
t = (0:dt)/dt;    %定义时间序列
x = sin(2*pi*t);  %定义函数
plot(t,x)         %画图
xlabel('时间');   %横坐标
ylabel('幅值');   %纵坐标
title('正弦函数') %标题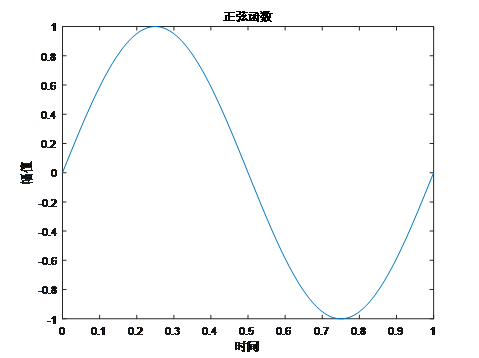
hold on可在绘图窗口继续画图,hold off结束
dt = 1000;
t = (0:dt)/dt;    %定义时间序列
x = sin(2*pi*t);  %定义函数
plot(t,x,'r')         %画图
xlabel('时间');   %横坐标
ylabel('幅值');   %纵坐标
hold on
y = cos(2*pi*t)
plot(t,y,'k');
legend('sin','cos');
hold off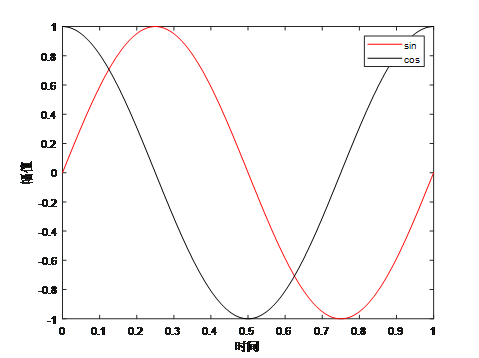
最后
以上就是内向火车最近收集整理的关于MATLAB初学第一天3的全部内容,更多相关MATLAB初学第一天3内容请搜索靠谱客的其他文章。
本图文内容来源于网友提供,作为学习参考使用,或来自网络收集整理,版权属于原作者所有。


发表评论 取消回复