前言
作为geek后端程序员,画图的选择其实有很多,手画,excel,ppt,copy别人的图等。虽然用excel最方便,但是类似按中国省份来显示详细数据的图,excel是画不了的,而PPT画起来又很费劲。而JS有工具却能轻松的解决这个问题,似乎又得学习前端来画图?
并不是。后端工程师擅长处理数据,而借用Spring Boot + ECharts,就能结合数据和前端快速的画一个优雅的图。
知识点
- Spring Boot : web-starer的引入、spring boot编译插件的引入。
- 模板引擎: Thymleaf的使用。html知识。
- webjar: webjar 和 webjar-locator 的使用。
- jQuery: ajax的用法。JS知识。
- ECharts: 图表的基本用法。ECharts官网
实战
1、环境准备
- 一台电脑
- InrelliJ IDEA
2、创建 Spring Boot 启动工程
完整Demo地址:https://github.com/mickjoust1018/mickjoust-boot-demo/tree/master/boot-echarts
- 新建包:com.mickjoust.demo.spring.boot
- 创建 Class :LocalChart
- 配置一个 @RestController 并使用 @SpringBootApplication 自动启动。
- 加载默认启动项:SpringApplication.run(LocalChart.class,args);
LocalChart.java 代码示例
package com.mickjoust.demo.spring.boot;

import com.alibaba.fastjson.JSON;
import lombok.AllArgsConstructor;
import lombok.Getter;
import lombok.NoArgsConstructor;
import lombok.Setter;
import org.springframework.boot.SpringApplication;
import org.springframework.boot.autoconfigure.SpringBootApplication;
import org.springframework.web.bind.annotation.GetMapping;
import org.springframework.web.bind.annotation.RequestMapping;
import org.springframework.web.bind.annotation.RestController;
import org.springframework.web.servlet.ModelAndView;

import java.util.ArrayList;
import java.util.HashMap;
import java.util.List;
import java.util.Map;

@RestController
@SpringBootApplication
public class LocalChart {

    public static void main(String[] args) {
        SpringApplication.run(LocalChart.class,args);
    }
}
- 配置 Maven 依赖。
pom.xml 示例
	<properties> //1
		<spring.boot.version>2.1.3.RELEASE</spring.boot.version>
	</properties>

    <build> //2
        <plugins>
            <plugin>
                <groupId>org.springframework.boot</groupId>
                <artifactId>spring-boot-maven-plugin</artifactId>
                <version>${spring.boot.version}</version>
                <executions>
                    <execution>
                        <goals>
                            <goal>repackage</goal>
                        </goals>
                    </execution>
                </executions>
            </plugin>
        </plugins>
    </build>

    <dependencies>
    	//3
        <dependency>
            <groupId>org.springframework.boot</groupId>
            <artifactId>spring-boot-starter-web</artifactId>
            <version>${spring.boot.version}</version>
        </dependency>
        <dependency>
            <groupId>org.springframework.boot</groupId>
            <artifactId>spring-boot-starter-thymeleaf</artifactId>
            <version>${spring.boot.version}</version>
        </dependency>

        //4
        <dependency>
            <groupId>org.projectlombok</groupId>
            <artifactId>lombok</artifactId>
            <version>1.18.8</version>
            <scope>provided</scope>
        </dependency>
        <dependency>
            <groupId>com.alibaba</groupId>
            <artifactId>fastjson</artifactId>
            <version>1.2.47</version>
        </dependency>
        <dependency>
            <groupId>org.webjars</groupId>
            <artifactId>webjars-locator</artifactId>
            <version>0.37</version>
        </dependency>
        <dependency>
            <groupId>org.webjars.bower</groupId>
            <artifactId>echarts</artifactId>
            <version>4.2.1</version>
        </dependency>
        <dependency>
            <groupId>org.webjars</groupId>
            <artifactId>jquery</artifactId>
            <version>3.4.1</version>
        </dependency>
        <dependency>
            <groupId>org.webjars</groupId>
            <artifactId>bootstrap</artifactId>
            <version>3.3.7</version>
        </dependency>
    </dependencies>
说明:
- 1:Spring Boot 使用 2.1.3.RELEASE 版本。
- 2:常规编译配置。
- 3:引入 spring-boot-starter-web、spring-boot-starter-thymeleaf 做基础支撑。
- 4:引入 lombok 、fastjson 做简化 get、set 和返回 json 数据;同时引入webjar 和 webjar-locator。
4、发布接口
我们定义两个接口:
- 一个页面展示:
/localchart - 一个返回json数据:
/getJsonData
再定义一个测试对象 User
	@RequestMapping("/localchart") //1
    public ModelAndView localChart(){
        ModelAndView model = new ModelAndView();
        User user = new User("蔬菜列表",new String[]{"土豆", "番茄", "白菜", "芹菜"});
        model.addObject(user);
        model.setViewName("localchart");
        return model;
    }

    @RequestMapping(value = "/getJsonData")
    public String getjsondata(){
    	return null;
    }

	@Getter
    @Setter
    @AllArgsConstructor
    class User { //2
        private String name;
        private String[] array;
    }
说明:
- 1:构建一个 User 对象的测试数据,并添加到 ModelAndView 对象中,然后设置 ViewName 来指定对应的html文件为localchart,html。
- 2:使用 lombok 注解来标示get、set和全参数构造函数。
5、构建html
既然我们想要展示图表,就需要一个html页面,我们这里使用 Spring Boot 御用的Thymleaf。
在 resources 下新建目录和文件:templates / localchart.html (templates 为默认目录地址)。
localchart.html 代码示例
<!DOCTYPE html>
<html lang="en" xmlns:th="http://www.thymeleaf.org">
<head> //1
    <meta charset="UTF-8"/>
    <title th:text="用户信息">User</title>
    <!--默认拼接前缀路径,开头请勿再添加斜杠,防止部署运行报错!-->
    <script th:replace="head::static"></script>
</head>
<body>
<!--测试使用--> //2
<h1 th:text="${user.name}">列表名称</h1>
<ul>
    <li th:each="item: ${user.array}" th:text="${item}">条目</li>
</ul>
head.html 代码示例:
<!DOCTYPE html>
<html xmlns:th="http://www.thymeleaf.org">
	<!--声明static为页面片段名称-->
	<head th:fragment="static"> //3
		<link th:href="@{/webjars/bootstrap/css/bootstrap.css}" rel="stylesheet" type="text/css"/>
		<script th:src="@{/webjars/jquery/jquery.js}"></script>
		<script th:src="@{/webjars/echarts/dist/echarts.js}"></script>
		<script th:src="@{/webjars/bootstrap/js/bootstrap.js}"></script>
	</head>
</html>
说明:
- 1:配置编码类型为:UTF-8;显示用户信息;使用静态头文件head.html。
- 2:显示一个简单的列表循环显示数据。
- 3:头文件,存放脚本和css引用。这里我们使用 webjar 和 webjar-locator。webjar-locator 的作用在于省略掉js包的版本号。
6、加入ECharts
到这里,已经能够成功的运行 Spring Boot 程序并显示测试列表了,不过,我们关注的重点是加入ECharts。
什么是ECharts?
ECharts,缩写来自 Enterprise Charts,商业级数据图表,是百度的一个开源的数据可视化工具,一个纯 Javascript 的图表库,能够在 PC 端和移动设备上流畅运行,兼容当前绝大部分浏览器(IE6/7/8/9/10/11,chrome,firefox,Safari等),底层依赖轻量级的 Canvas 库 ZRender。
曾经我用过老牌的 highcharts,感觉还行,那时的 ECharts 做得还很一般,不过中文文档很详细,然后,ECharts 这些年慢慢就反超了,关键是 ECharts 能用中国地图,这点是 highcharts 不能比的。
实战继续。
官方示例一般都是选柱状图,我们这里选思维导图。
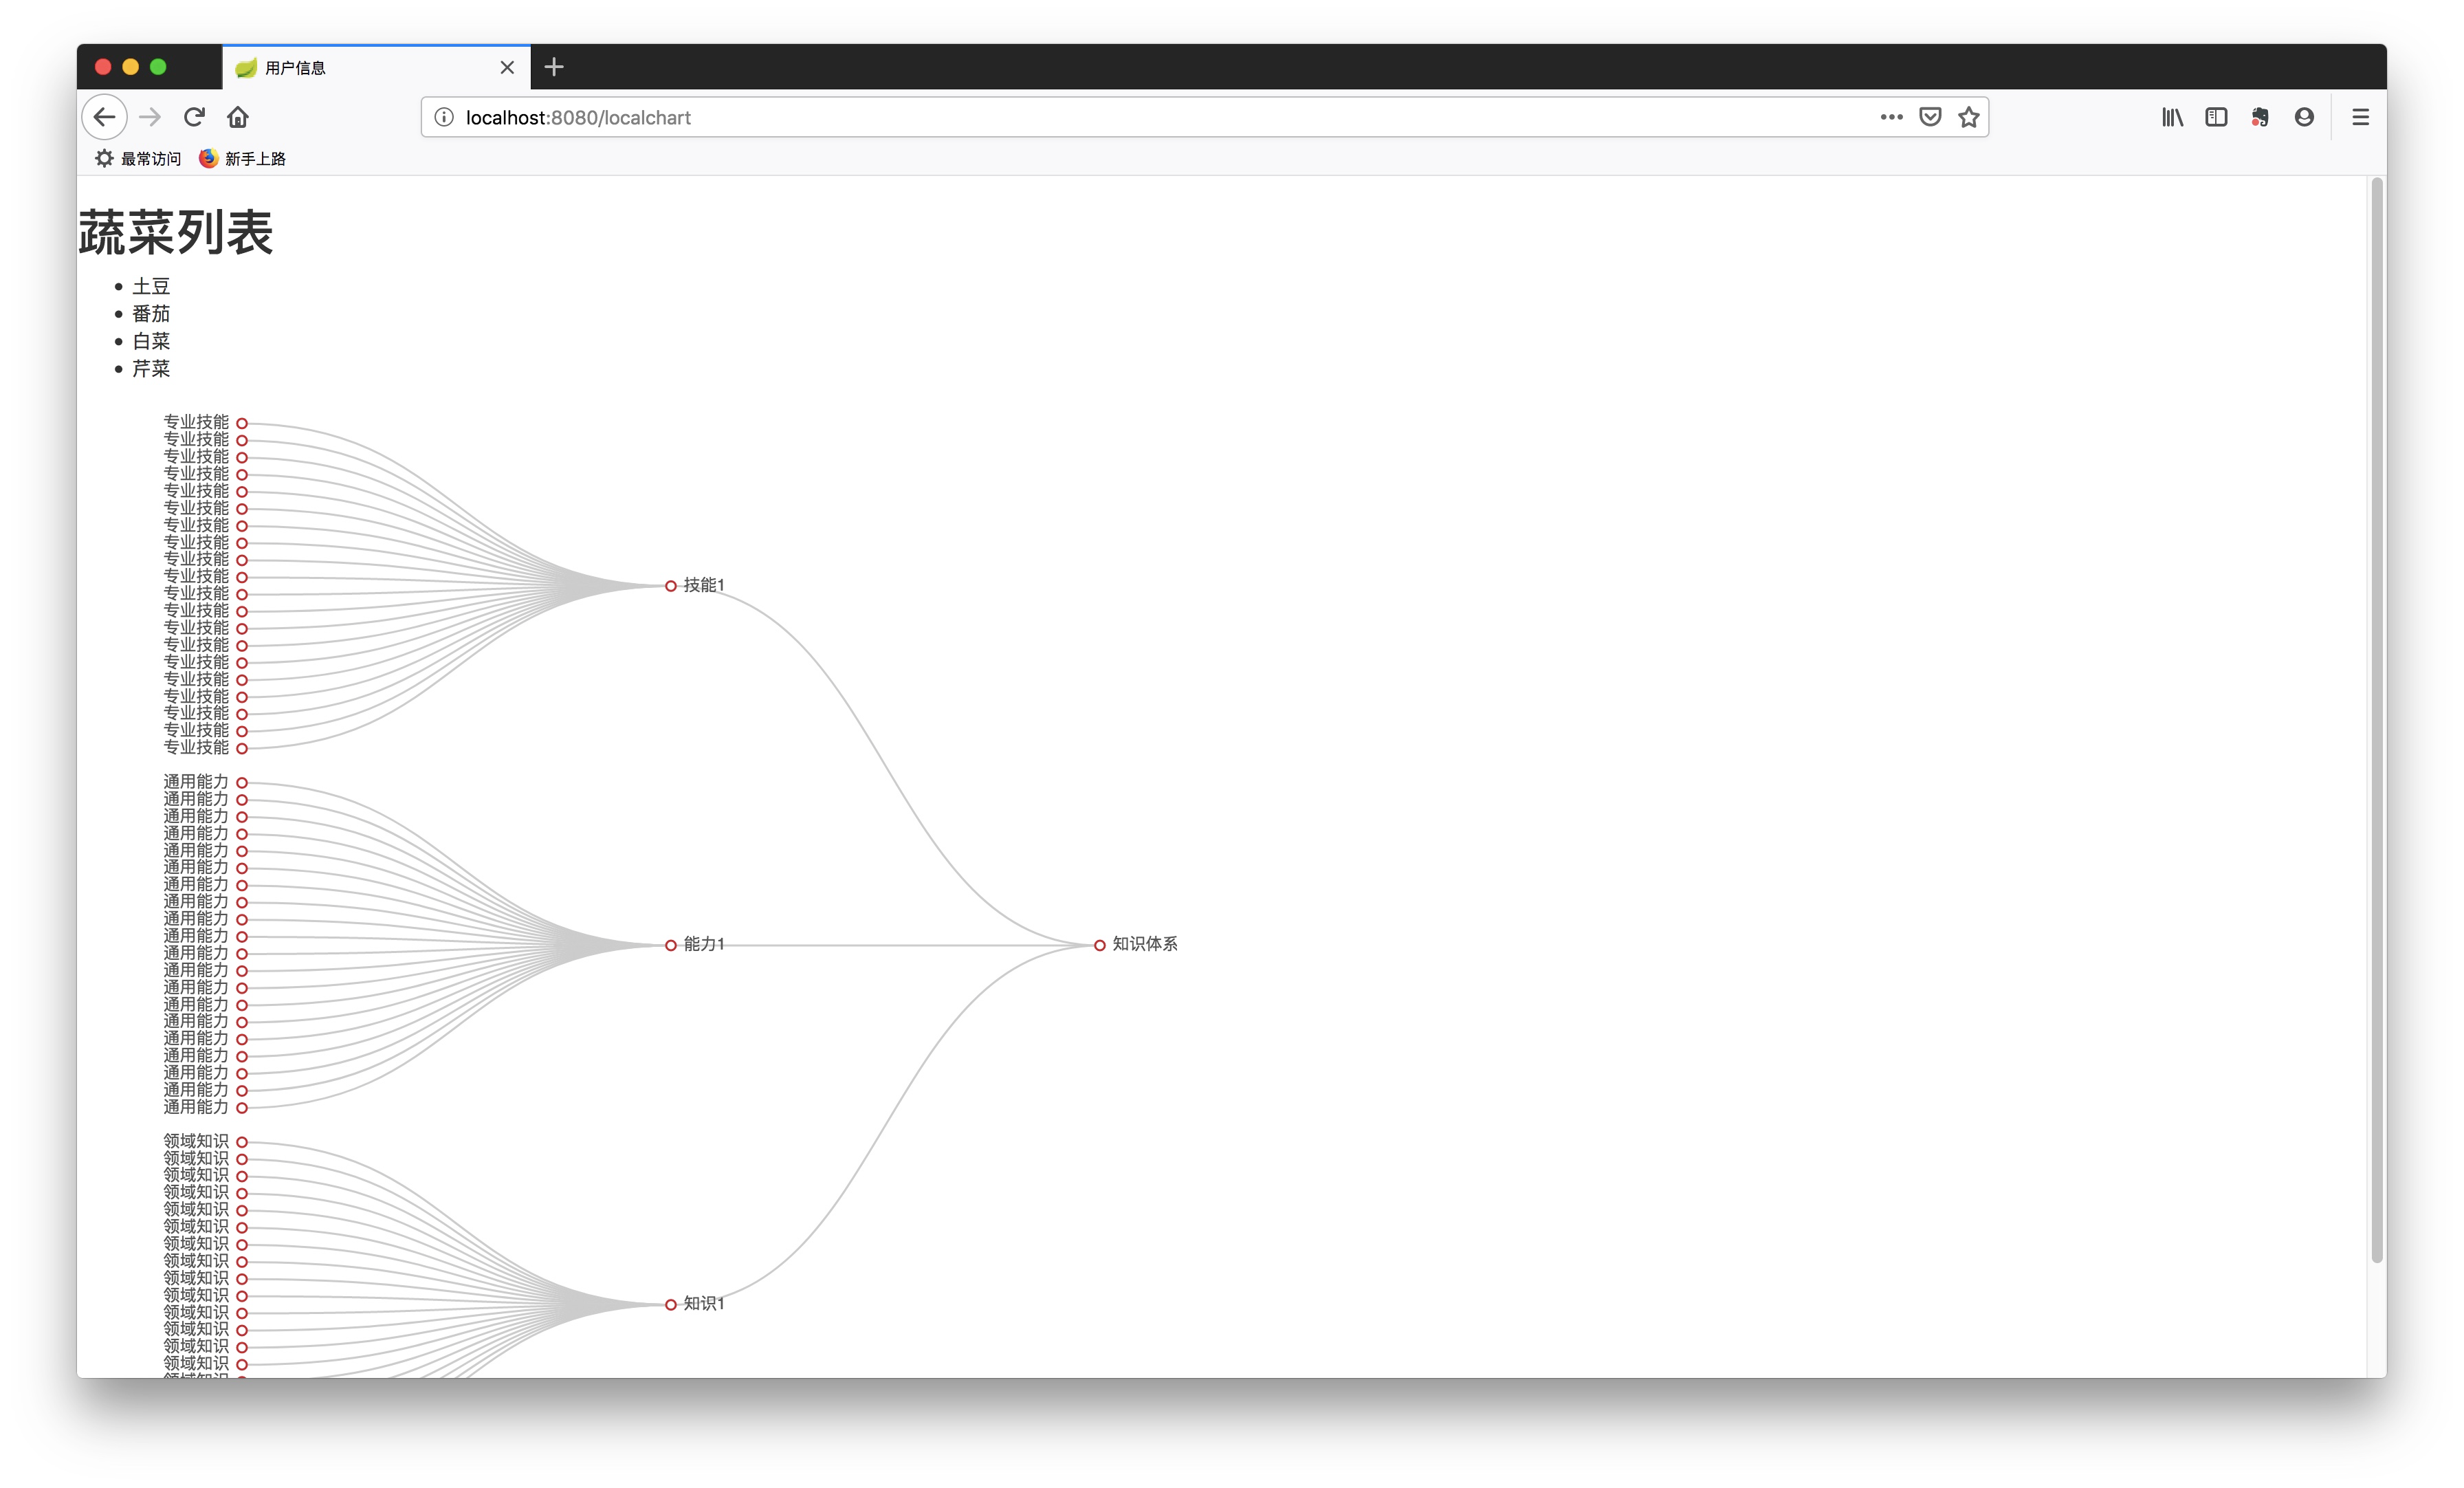
首先,构建数据。
@RequestMapping(value = "/getJsonData")
    public String getjsondata(){
        Map<String,Object> map = new HashMap<String, Object>();
        map.put("123",123);
        Tree root = new Tree();
        List<Tree> rootChildren = new ArrayList<Tree>();
        root.setName("知识体系");
        root.setChildren(rootChildren);

        Tree root11 =new Tree("技能1");
        Tree root12 =new Tree("能力1");
        Tree root13 =new Tree("知识1");

        rootChildren.add(root11);
        rootChildren.add(root12);
        rootChildren.add(root13);

        List<Tree> pointList11 = new ArrayList<Tree>();
        List<Tree> pointList12 = new ArrayList<Tree>();
        List<Tree> pointList13 = new ArrayList<Tree>();

        for (int i = 0; i < 20; i++) {
            pointList11.add(new Tree("专业技能",111111+i));
        }
        for(int i = 0; i < 20; i++) {
            pointList12.add(new Tree("通用能力",222222+i));
        }
        for(int i = 0; i < 20; i++) {
            pointList13.add(new Tree("领域知识",333333));
        }
        root11.setChildren(pointList11);
        root12.setChildren(pointList12);
        root13.setChildren(pointList13);

        return JSON.toJSONString(root);
    }
其次,在 localchart.html 里加入如下代码:
<!-- 为 ECharts 准备一个具备大小(宽高)的 DOM -->
<div id="main" style="width: 800px;height:800px;"></div> //1
<script>
    var myChart = echarts.init(document.getElementById('main')); //2

    myChart.showLoading(); //3

    $.ajax({ //4
        type : "post",
        async : true,//异步请求(同步请求将会锁住浏览器,用户其他操作必须等待请求完成才可以执行)
        url : "http://localhost:8080/getJsonData",    //请求发送给数据接口
        data : {},
        dataType: "json",
        success : function(result) {
            //请求成功时执行该函数内容,result即为服务器返回的json对象
            if (result) {
                myChart.hideLoading(); //5

                myChart.setOption(option = { //6

                    tooltip: {
                        trigger: 'item',
                        triggerOn: 'mousemove'
                    },

                    series:[
                        {
                            type: 'tree',

                            data: [result], //7

                            top: '1%',
                            left: '15%',
                            bottom: '1%',
                            right: '7%',

                            symbolSize: 7,

                            orient: 'RL',

                            label: {
                                position: 'right',
                                verticalAlign: 'middle',
                                align: 'left'
                            },

                            leaves: {
                                label: {
                                    position: 'left',
                                    verticalAlign: 'middle',
                                    align: 'right'
                                }
                            },

                            expandAndCollapse: true,
                            animationDuration: 550,
                            animationDurationUpdate: 750
                        }
                    ]
                });
            }
        },
        error : function(errorMsg) {
            //请求失败时执行该函数
            alert("请求数据失败!");
            myChart.hideLoading();
        }
    })
</script>
说明:
- 1:配置显示框大小,作为渲染的DOM容器。
- 2:初始化容器。
- 3:显示进度圈。
- 4:使用jquery发送ajax请求,这里使用异步获取json数据。
- 5:获取结果后,隐藏进度圈。
- 6:传入渲染数据的参数。
- 7:result放这里。至于其它参数,有兴趣的同学可去官网研究。
7、 运行
先运行程序,再在浏览器输入:http://localhost:8080/localchart ,效果如下:

小结
通过Spring Boot 的快速启动,加上模板引擎的简洁语法,我们一起快速构建了ECharts 的本地图表程序。
顺便复习了如下知识点:
- Spring Boot : spring-boot的使用。
- 模板引擎: Thymleaf的使用。html知识。
- webjar: webjar 和 webjar-locator 的使用。
- jQuery: ajax的用法。JS知识。
- ECharts: 图表的基本用法。ECharts官网
干嘛非得这么麻烦?
因为这是快速构建监控系统界面的基础,也是给上级领导汇报时,不再苦于数据还得用Excel来画的一种解法。
echarts功能很强大,配置其实很简单,我们只需要使用数据和渲染分离的思维,就能快速画出漂亮的图,而如果用ppt工具或者excel反而更麻烦。这是作为geek程序员的一大好处之一。
完整Demo地址:https://github.com/mickjoust1018/mickjoust-boot-demo/tree/master/boot-echarts
最后
以上就是友好小土豆最近收集整理的关于Spring Boot 实践折腾记(20):Thymleaf + webjar + ECharts 构建本地图表的全部内容,更多相关Spring内容请搜索靠谱客的其他文章。


发表评论 取消回复