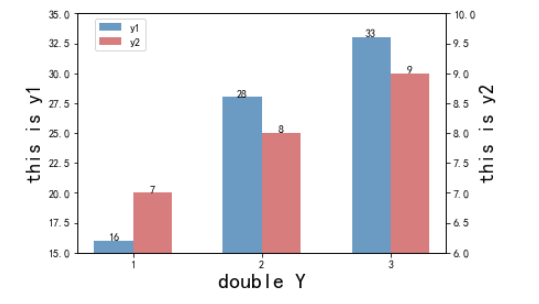
效果图:
代码如下:
import matplotlib.pyplot as plt
import numpy as np
plt.rc('font',family='Times New Roman')
x_data = ['1','2','3']
ax_data = [16,28,33]
ax1_data = [7,8,9]

fig=plt.figure(dpi=600)
ax=fig.add_subplot(111)

ax.set_ylim([15,35])
ax.set_yticks=np.arange(15,35)
ax.set_yticklabels=np.arange(15,35)

bar_width = 0.3
ax.set_ylabel('this is y1',fontsize=18,fontweight='bold');
lns1=ax.bar(x=np.arange(len(x_data)), width=bar_width, height=ax_data, label='y1', fc = 'steelblue',alpha=0.8)

for a,b in enumerate(ax_data):
    plt.text(a,b+0.0005,'%s' % b,ha='center')


ax1 = ax.twinx() # this is the important function

ax1.set_ylim([6,10])
ax1.set_yticks=np.arange(6,10)
ax1.set_yticklabels=np.arange(6,10)
ax1.set_ylabel('this is y2',fontsize=18,fontweight='bold');
lns2=ax1.bar(x=np.arange(len(x_data))+bar_width, width=bar_width, height=ax1_data,label='y2',fc = 'indianred',alpha=0.8)

for a,b in enumerate(ax1_data):
    plt.text(a+0.3,b+0.001,'%s' % b,ha='center')

plt.xticks(np.arange(len(x_data))+bar_width/2, x_data)

ax.set_xlabel('double Y',fontsize=20,fontweight='bold')

fig.legend(loc=1,bbox_to_anchor=(0.28,1),bbox_transform=ax.transAxes)

plt.savefig('your path/name.png')  #图表输出
参数可以根据自己的需要修改
最后
以上就是激昂唇膏最近收集整理的关于顶会常见的 python matplotlib 双Y轴柱状图的全部内容,更多相关顶会常见的内容请搜索靠谱客的其他文章。
本图文内容来源于网友提供,作为学习参考使用,或来自网络收集整理,版权属于原作者所有。


发表评论 取消回复