关于MATLAB 直方图
整理记录histogram2 —三维直方图的一些用法及拓展应用
散点绘制直方图
h = histogram2(Xe,Ye,10,'FaceColor','flat'),title('Entries'),xlabel('Xe'),ylabel('Ye'),colorbar,grid on
- Xe Ye,均为列向量;
- 10 ,bin number;
得到直方图的一些特性
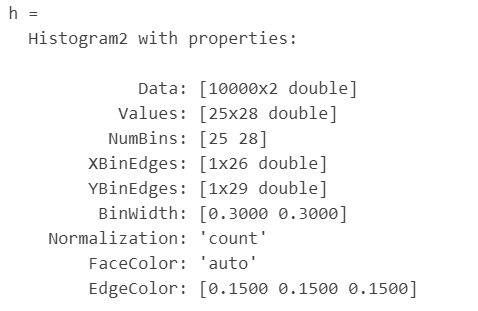
提取部分特性加以运用
- 提取bin边界的数据
array1 = h.XBinEdges;   %提取X轴边界的列向量数据
array2 = h.XBinEdges;   %提取X轴边界的列向量数据
- 提取bin中点的数据
array1 = h.XBinEdges;   %提取X轴边界的列向量数据
array2 = h.YBinEdges;   %提取X轴边界的列向量数据

%%方法1
array3 = (array1(1:end-1)+array1(2:end))/2;  %提取X轴bin中点值的列向量数据
array4 = (array2(1:end-1)+array2(2:end))/2;  %提取Y轴bin中点值的列向量数据

%%方法2
array3 = movmean(array1, 2, 'Endpoints', 'discard');  %提取X轴bin中点值的列向量数据
array4 = movmean(array2, 2, 'Endpoints', 'discard');  %提取Y轴bin中点值的列向量数据
- 提取bin中点的数据
counts = h.Values
散点绘制直方图
直接设置bin edges的数据,来绘制不等份或等份的直方图
x = randn(1000,1);
y = randn(1000,1);
Xedges = [-Inf -2:0.4:2 Inf];
Yedges = [-Inf -2:0.4:2 Inf];
h = histogram2(x,y,Xedges,Yedges)
参考链接
[1]https://ww2.mathworks.cn/help/matlab/ref/matlab.graphics.chart.primitive.histogram2.html
[2]https://cloud.tencent.com/developer/ask/151229
最后
以上就是懵懂香烟最近收集整理的关于关于MATLAB直方图的绘制及应用关于MATLAB 直方图的全部内容,更多相关关于MATLAB直方图的绘制及应用关于MATLAB内容请搜索靠谱客的其他文章。
本图文内容来源于网友提供,作为学习参考使用,或来自网络收集整理,版权属于原作者所有。


发表评论 取消回复