【ABCNet训练自己的模型(二)】
【ABCNet训练自己的模型(三)】
数据标注
标注工具-labelme
下载链接
https://github.com/wkentaro/labelme
安装
windows
conda create –n labelme python=3.6
conda activate labelme
pip install labelme
标注工具windows_label_tool
可以直接转成abcnet训练的数据
数据集制作
labelme格式转windows_label_tool
格式如下
由8个点和标签组成,8个点是上下4个起始和结束点和4个控制点
504.96,173.19,597.18,72.88,774.98,117.75,831.84,232.33,808.18,264.59,753.16,165.61,607.18,147.01,525.39,223.73||||x009404027002
代码如下:
# coding=utf-8
# labelme 标注的json文件标注转abcnet 的标注,如果直接使用windowlabel工具标注则可省去此步骤
import numpy as np
import matplotlib.pyplot as plt
import matplotlib.image as mpimg
from scipy import interpolate
from scipy.special import comb as n_over_k
import glob, os
import cv2

from skimage import data, color
from skimage.transform import rescale, resize, downscale_local_mean
import json
import matplotlib.pyplot as plt
import math
import numpy as np
import random
import torch
from torch import nn

from sklearn.model_selection import train_test_split
from sklearn.linear_model import LinearRegression
from sklearn import metrics
from sklearn.metrics import mean_squared_error, r2_score

from shapely.geometry import *
import time
import math
import re


class Bezier(nn.Module):
    def __init__(self, ps, ctps):
        """
        ps: numpy array of points
        """
        super(Bezier, self).__init__()
        self.x1 = nn.Parameter(torch.as_tensor(ctps[0], dtype=torch.float64))
        self.x2 = nn.Parameter(torch.as_tensor(ctps[2], dtype=torch.float64))
        self.y1 = nn.Parameter(torch.as_tensor(ctps[1], dtype=torch.float64))
        self.y2 = nn.Parameter(torch.as_tensor(ctps[3], dtype=torch.float64))
        self.x0 = ps[0, 0]
        self.x3 = ps[-1, 0]
        self.y0 = ps[0, 1]
        self.y3 = ps[-1, 1]
        self.inner_ps = torch.as_tensor(ps[1:-1, :], dtype=torch.float64)
        self.t = torch.as_tensor(np.linspace(0, 1, 81))

    def forward(self):
        x0, x1, x2, x3, y0, y1, y2, y3 = self.control_points()
        t = self.t
        bezier_x = (1 - t) * ((1 - t) * ((1 - t) * x0 + t * x1) + t * ((1 - t) * x1 + t * x2)) + t * (
                    (1 - t) * ((1 - t) * x1 + t * x2) + t * ((1 - t) * x2 + t * x3))
        bezier_y = (1 - t) * ((1 - t) * ((1 - t) * y0 + t * y1) + t * ((1 - t) * y1 + t * y2)) + t * (
                    (1 - t) * ((1 - t) * y1 + t * y2) + t * ((1 - t) * y2 + t * y3))
        bezier = torch.stack((bezier_x, bezier_y), dim=1)
        diffs = bezier.unsqueeze(0) - self.inner_ps.unsqueeze(1)
        sdiffs = diffs ** 2
        dists = sdiffs.sum(dim=2).sqrt()
        min_dists, min_inds = dists.min(dim=1)
        return min_dists.sum()

    def control_points(self):
        return self.x0, self.x1, self.x2, self.x3, self.y0, self.y1, self.y2, self.y3

    def control_points_f(self):
        return self.x0, self.x1.item(), self.x2.item(), self.x3, self.y0, self.y1.item(), self.y2.item(), self.y3


def train(x, y, ctps, lr):
    x, y = np.array(x), np.array(y)
    ps = np.vstack((x, y)).transpose()
    bezier = Bezier(ps, ctps)

    return bezier.control_points_f()


def draw(ps, control_points, t):
    x = ps[:, 0]
    y = ps[:, 1]
    x0, x1, x2, x3, y0, y1, y2, y3 = control_points
    fig = plt.figure()
    ax = fig.add_subplot(111)
    ax.plot(x, y, color='m', linestyle='', marker='.')
    bezier_x = (1 - t) * ((1 - t) * ((1 - t) * x0 + t * x1) + t * ((1 - t) * x1 + t * x2)) + t * (
                (1 - t) * ((1 - t) * x1 + t * x2) + t * ((1 - t) * x2 + t * x3))
    bezier_y = (1 - t) * ((1 - t) * ((1 - t) * y0 + t * y1) + t * ((1 - t) * y1 + t * y2)) + t * (
                (1 - t) * ((1 - t) * y1 + t * y2) + t * ((1 - t) * y2 + t * y3))

    # plt.plot(bezier_x, bezier_y, 'g-')
    # plt.draw()
    # plt.pause(1)  # <-------
    # # raw_input("<Hit Enter To Close>")
    # plt.close(fig)


Mtk = lambda n, t, k: t ** k * (1 - t) ** (n - k) * n_over_k(n, k)
BezierCoeff = lambda ts: [[Mtk(3, t, k) for k in range(4)] for t in ts]


def bezier_fit(x, y):
    dy = y[1:] - y[:-1]
    dx = x[1:] - x[:-1]
    dt = (dx ** 2 + dy ** 2) ** 0.5
    t = dt / dt.sum()
    t = np.hstack(([0], t))
    t = t.cumsum()

    data = np.column_stack((x, y))
    Pseudoinverse = np.linalg.pinv(BezierCoeff(t))  # (9,4) -> (4,9)

    control_points = Pseudoinverse.dot(data)  # (4,9)*(9,2) -> (4,2)
    medi_ctp = control_points[1:-1, :].flatten().tolist()
    return medi_ctp


def bezier_fitv2(x, y):
    xc01 = (2 * x[0] + x[-1]) / 3.0
    yc01 = (2 * y[0] + y[-1]) / 3.0
    xc02 = (x[0] + 2 * x[-1]) / 3.0
    yc02 = (y[0] + 2 * y[-1]) / 3.0
    control_points = [xc01, yc01, xc02, yc02]
    return control_points


def is_close_to_line(xs, ys, thres):
    regression_model = LinearRegression()
    # Fit the data(train the model)
    regression_model.fit(xs.reshape(-1, 1), ys.reshape(-1, 1))
    # Predict
    y_predicted = regression_model.predict(xs.reshape(-1, 1))

    # model evaluation
    rmse = mean_squared_error(ys.reshape(-1, 1) ** 2, y_predicted ** 2)
    rmse = rmse / (ys.reshape(-1, 1) ** 2 - y_predicted ** 2).max() ** 2

    if rmse > thres:
        return 0.0
    else:
        return 2.0


def is_close_to_linev2(xs, ys, size, thres=0.05):
    pts = []
    nor_pixel = int(size ** 0.5)
    for i in range(len(xs)):
        pts.append(Point([xs[i], ys[i]]))
    import itertools
    # iterate by pairs of points
    slopes = [(second.y - first.y) / (second.x - first.x) if not (second.x - first.x) == 0.0 else math.inf * np.sign(
        (second.y - first.y)) for first, second in zip(pts, pts[1:])]
    st_slope = (ys[-1] - ys[0]) / (xs[-1] - xs[0])
    max_dis = ((ys[-1] - ys[0]) ** 2 + (xs[-1] - xs[0]) ** 2) ** (0.5)

    diffs = abs(slopes - st_slope)
    score = diffs.sum() * max_dis / nor_pixel

    if score < thres:
        return 0.0
    else:
        return 3.0


labels = glob.glob("data/json/*.json")
labels.sort()

if not os.path.isdir('abcnet_gen_labels'):
    os.mkdir('abcnet_gen_labels')

for il, label in enumerate(labels):
    print('Processing: ' + label)
    imgdir = label.replace('json/', 'image/').replace('.json', '.png')

    outgt = open(label.replace('dataset/json/', 'abcnet_gen_labels/').replace('.json', '.txt'), 'w')

    data = []
    cts = []
    with open(label, "r") as f:
        jdata = json.loads(f.read())
    boxes = jdata["shapes"]
    for il, box in enumerate(boxes):
        line, ct = box["points"], box["label"]
        pts = []
        [pts.extend(p) for p in line]
        if len(line) == 4:
            pts = line[0] + [(line[0][0] + line[1][0]) // 2, (line[0][1] + line[1][1]) // 2] + line[1] + line[2] + [
                (line[2][0] + line[3][0]) / 2, (line[2][1] + line[3][1]) / 2] + line[3]
        if len(line) == 6:
            if abs(line[0][0] - line[1][0]) > abs(line[1][0] - line[2][0]):
                pts = line[0] + [(line[0][0] + line[1][0]) // 2, (line[0][1] + line[1][1]) // 2] + line[1] + line[2]
                pts += line[3] + [(line[3][0] + line[4][0]) // 2, (line[3][1] + line[4][1]) // 2] + line[4] + line[5]
            else:
                pts = line[0] + line[1] + [(line[1][0] + line[2][0]) // 2, (line[1][1] + line[2][1]) // 2] + line[2]
                pts += line[3] + line[4] + [(line[4][0] + line[5][0]) // 2, (line[4][1] + line[5][1]) // 2] + line[5]
        data.append(np.array([float(x) for x in pts]))
        cts.append(ct)

    ############## top
    img = plt.imread(imgdir)

    for iid, ddata in enumerate(data):
        lh = len(data[iid])
        if lh % 4 != 0:
            print("error: {}".format(label))
            break
        lhc2 = int(lh / 2)
        lhc4 = int(lh / 4)
        xcors = [data[iid][i] for i in range(0, len(data[iid]), 2)]
        ycors = [data[iid][i + 1] for i in range(0, len(data[iid]), 2)]

        curve_data_top = data[iid][0:lhc2].reshape(lhc4, 2)
        curve_data_bottom = data[iid][lhc2:].reshape(lhc4, 2)

        left_vertex_x = [curve_data_top[0, 0], curve_data_bottom[lhc4 - 1, 0]]
        left_vertex_y = [curve_data_top[0, 1], curve_data_bottom[lhc4 - 1, 1]]
        right_vertex_x = [curve_data_top[lhc4 - 1, 0], curve_data_bottom[0, 0]]
        right_vertex_y = [curve_data_top[lhc4 - 1, 1], curve_data_bottom[0, 1]]

        x_data = curve_data_top[:, 0]
        y_data = curve_data_top[:, 1]

        init_control_points = bezier_fit(x_data, y_data)

        learning_rate = is_close_to_linev2(x_data, y_data, img.size)

        x0, x1, x2, x3, y0, y1, y2, y3 = train(x_data, y_data, init_control_points, learning_rate)
        control_points = np.array([
            [x0, y0],
            [x1, y1],
            [x2, y2],
            [x3, y3]
        ])

        x_data_b = curve_data_bottom[:, 0]
        y_data_b = curve_data_bottom[:, 1]

        init_control_points_b = bezier_fit(x_data_b, y_data_b)

        learning_rate = is_close_to_linev2(x_data_b, y_data_b, img.size)

        x0_b, x1_b, x2_b, x3_b, y0_b, y1_b, y2_b, y3_b = train(x_data_b, y_data_b, init_control_points_b, learning_rate)
        control_points_b = np.array([
            [x0_b, y0_b],
            [x1_b, y1_b],
            [x2_b, y2_b],
            [x3_b, y3_b]
        ])

        t_plot = np.linspace(0, 1, 81)
        Bezier_top = np.array(BezierCoeff(t_plot)).dot(control_points)
        Bezier_bottom = np.array(BezierCoeff(t_plot)).dot(control_points_b)

        plt.plot(Bezier_top[:, 0], Bezier_top[:, 1], 'g-', label='fit', linewidth=1)
        plt.plot(Bezier_bottom[:, 0], Bezier_bottom[:, 1], 'g-', label='fit', linewidth=1)
        plt.plot(control_points[:, 0], control_points[:, 1], 'r.:', fillstyle='none', linewidth=1)
        plt.plot(control_points_b[:, 0], control_points_b[:, 1], 'r.:', fillstyle='none', linewidth=1)

        plt.plot(left_vertex_x, left_vertex_y, 'g-', linewidth=1)
        plt.plot(right_vertex_x, right_vertex_y, 'g-', linewidth=1)

        outstr = '{},{},{},{},{},{},{},{},{},{},{},{},{},{},{},{}||||{}n'.format(round(x0, 2), round(y0, 2),
                                                                                  round(x1, 2), round(y1, 2),
                                                                                  round(x2, 2), round(y2, 2),
                                                                                  round(x3, 2), round(y3, 2),
                                                                                  round(x0_b, 2), round(y0_b, 2),
                                                                                  round(x1_b, 2), round(y1_b, 2),
                                                                                  round(x2_b, 2), round(y2_b, 2),
                                                                                  round(x3_b, 2), round(y3_b, 2),
                                                                                  cts[iid])
        outgt.writelines(outstr)
    outgt.close()

    plt.imshow(img)
    plt.axis('off')

    if not os.path.isdir('abcnet_vis'):
        os.mkdir('abcnet_vis')
    plt.savefig('abcnet_vis/' + os.path.basename(imgdir), bbox_inches='tight', dpi=400)
    plt.clf()
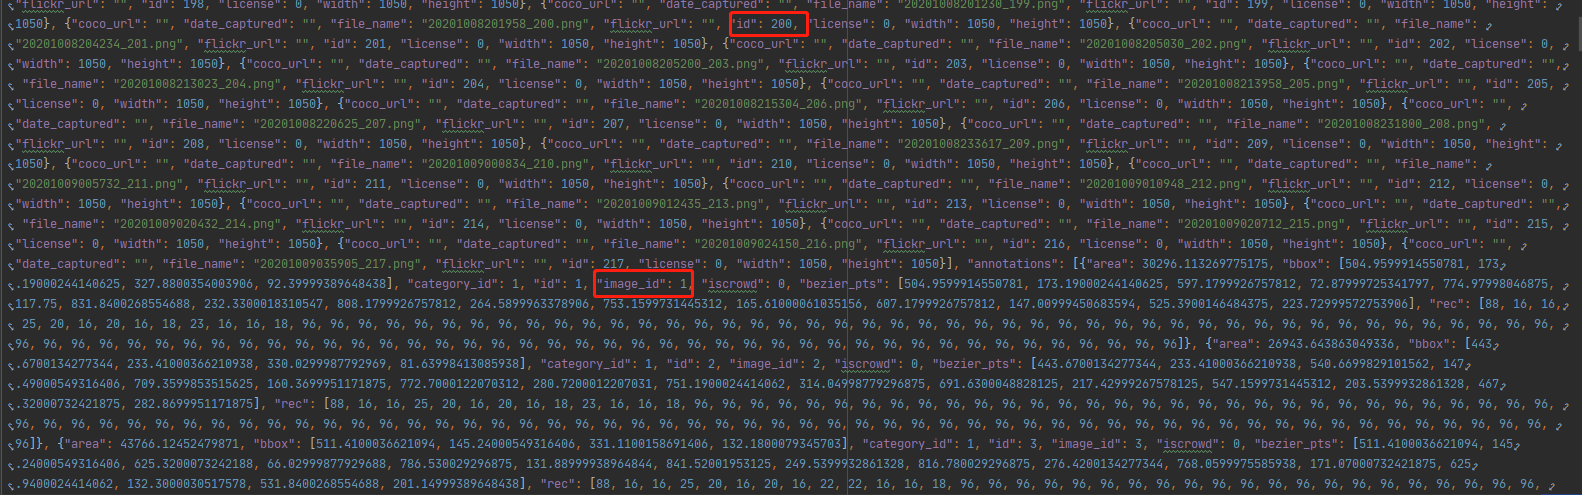
将windows_label_tool转成abcnet的训练数据
格式如下
image的id和annotations的image_id对应唯一标识,annotations的id是自增id;
代码如下:
# -*- coding: utf-8 -*-
"""
 @File    : convert_ann_to_json.py
 @Time    : 2020-8-17 16:13
 @Author  : yizuotian
 @Description    : 生成windows_label_tool工具的标注格式转换为ABCNet训练的json格式标注
"""
import argparse
import json
import os
import sys
import cv2
# import bezier_utils
import numpy as np


def gen_abc_json(abc_gt_dir, abc_json_path, image_dir, classes_path):
    """
    根据abcnet的gt标注生成coco格式的json标注
    :param abc_gt_dir: windows_label_tool标注工具生成标注文件目录
    :param abc_json_path: ABCNet训练需要json标注路径
    :param image_dir:
    :param classes_path: 类别文件路径
    :return:
    """
    # Desktop Latin_embed.
    cV2 = [' ', '!', '"', '#', '$', '%', '&', ''', '(', ')', '*', '+', ',', '-', '.', '/', '0', '1', '2', '3', '4',
           '5', '6', '7', '8', '9', ':', ';', '<', '=', '>', '?', '@', 'A', 'B', 'C', 'D', 'E', 'F', 'G', 'H', 'I', 'J',
           'K', 'L', 'M', 'N', 'O', 'P', 'Q', 'R', 'S', 'T', 'U', 'V', 'W', 'X', 'Y', 'Z', '[', '\', ']', '^', '_',
           '`', 'a', 'b', 'c', 'd', 'e', 'f', 'g', 'h', 'i', 'j', 'k', 'l', 'm', 'n', 'o', 'p', 'q', 'r', 's', 't', 'u',
           'v', 'w', 'x', 'y', 'z', '{', '|', '}', '~']

    dataset = {
        'licenses': [],
        'info': {},
        'categories': [],
        'images': [],
        'annotations': []
    }
    with open(classes_path) as f:
        classes = f.read().strip().split()
    for i, cls in enumerate(classes, 1):
        dataset['categories'].append({
            'id': i,
            'name': cls,
            'supercategory': 'beverage',
            'keypoints': ['mean',
                          'xmin',
                          'x2',
                          'x3',
                          'xmax',
                          'ymin',
                          'y2',
                          'y3',
                          'ymax',
                          'cross']  # only for BDN
        })

    def get_category_id(cls):
        for category in dataset['categories']:
            if category['name'] == cls:
                return category['id']

    # 遍历abcnet txt 标注
    indexes = sorted([f.split('.')[0]
                      for f in os.listdir(abc_gt_dir)])
    print(indexes)

    j = 1  # 标注边框id号
    # 图像唯一标识
    img_index_only = 0
    for index in indexes:
        # if int(index) >3: continue
        # print('Processing: ' + index)
        img_index_only += 1
        im = cv2.imread(os.path.join(image_dir, '{}.png'.format(index)))
        cv2.imwrite("./data/image/{}.png".format(index.split("_")[0]+"_"+str(img_index_only)), im)
        im_height, im_width = im.shape[:2]
        dataset['images'].append({
            'coco_url': '',
            'date_captured': '',
            'file_name': index.split("_")[0] + "_" + str(img_index_only) + '.png',
            'flickr_url': '',
            'id': img_index_only,  # img_1
            'license': 0,
            'width': im_width,
            'height': im_height
        })
        anno_file = os.path.join(abc_gt_dir, '{}.txt'.format(index))

        with open(anno_file) as f:
            lines = [line for line in f.readlines() if line.strip()]
        # 没有清晰的标注,跳过
        # if len(lines) <= 1:
        #     continue
        for i, line in enumerate(lines[0:]):
            elements = line.strip().split("||||")[0].split(",")
            control_points = np.array(elements[:16]).reshape((-1, 2)).astype(np.float32)  # [14,(x,y)]
            # control_points = bezier_utils.polygon_to_bezier_pts(polygon, im)  # [8,(x,y)]
            ct = line.strip().split("||||")[-1].replace('"', '').strip()

            cls = 'text'
            # segs = [float(kkpart) for kkpart in parts[:16]]
            segs = [float(kkpart) for kkpart in control_points.flatten()]
            xt = [segs[ikpart] for ikpart in range(0, len(segs), 2)]
            yt = [segs[ikpart] for ikpart in range(1, len(segs), 2)]

            # 过滤越界边框
            if max(xt) > im_width or max(yt) > im_height:
                print('The annotation bounding box is outside of the image:{}'.format(index))
                print("max x:{},max y:{},w:{},h:{}".format(max(xt), max(yt), im_width, im_height))
                continue
            xmin = min([xt[0], xt[3], xt[4], xt[7]])
            ymin = min([yt[0], yt[3], yt[4], yt[7]])
            xmax = max([xt[0], xt[3], xt[4], xt[7]])
            ymax = max([yt[0], yt[3], yt[4], yt[7]])
            width = max(0, xmax - xmin + 1)
            height = max(0, ymax - ymin + 1)
            if width == 0 or height == 0:
                continue

            max_len = 100
            recs = [len(cV2) + 1 for ir in range(max_len)]

            ct = str(ct)
            # print('rec', ct)

            for ix, ict in enumerate(ct):
                if ix >= max_len:
                    continue
                if ict in cV2:
                    recs[ix] = cV2.index(ict)
                else:
                    recs[ix] = len(cV2)

            dataset['annotations'].append({
                'area': width * height,
                'bbox': [xmin, ymin, width, height],
                'category_id': get_category_id(cls),
                'id': j,
                'image_id': img_index_only,  # img_1
                'iscrowd': 0,
                'bezier_pts': segs,
                'rec': recs
            })
            j += 1

    # 写入json文件
    folder = os.path.dirname(abc_json_path)
    if not os.path.exists(folder):
        os.makedirs(folder)
    with open(abc_json_path, 'w') as f:
        json.dump(dataset, f)


def main(args):
    gen_abc_json(args.ann_dir, args.dst_json_path, args.image_dir, args.classes_path)


if __name__ == '__main__':
    """
    Usage: python convert_ann_to_json.py
    --ann-dir /path/to/gt
    --image-dir /path/to/image
    --dst-json-path train.json
    """
    parse = argparse.ArgumentParser()
    parse.add_argument("--ann-dir", type=str, default="abcnet_gen_labels")
    parse.add_argument("--image-dir", type=str, default="./data/json")
    parse.add_argument("--dst-json-path", type=str, default="./train.json")
    parse.add_argument("--classes-path", type=str, default='./classes.txt')
    arguments = parse.parse_args()  # sys.argv[1:]
    main(arguments)
最后
以上就是失眠小海豚最近收集整理的关于【ABCNet】ABCNet训练自己的模型(一)数据标注数据集制作的全部内容,更多相关【ABCNet】ABCNet训练自己内容请搜索靠谱客的其他文章。
本图文内容来源于网友提供,作为学习参考使用,或来自网络收集整理,版权属于原作者所有。


发表评论 取消回复