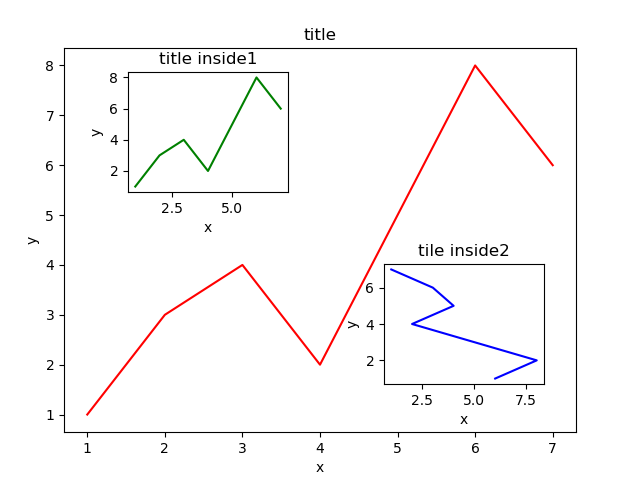
画一个如上图一样的嵌套图
代码如下:
import matplotlib.pyplot as plt

fig = plt.figure()

x = [1,2,3,4,5,6,7]
y = [1,3,4,2,5,8,6]


left, bottom, width, height = 0.1,0.1,0.8,0.8
ax1 = fig.add_axes([left,bottom,width,height])
ax1.plot(x,y,'r')
ax1.set_xlabel("x")
ax1.set_ylabel("y")
ax1.set_title('title')

left, bottom, width, height = 0.2,0.6,0.25,0.25
ax2 = fig.add_axes([left,bottom,width,height])
ax2.plot(x,y,'g')
ax2.set_xlabel('x')
ax2.set_ylabel('y')
ax2.set_title('title inside1')

left, bottom, width, height = 0.6,0.2,0.25,0.25
plt.axes([left,bottom,width,height])
plt.plot(y[::-1],x,'b')
plt.xlabel('x')
plt.ylabel('y')
plt.title('tile inside2')

plt.show()
最后
以上就是包容大叔最近收集整理的关于Python:(使用matplotlib画图)图中嵌套子图的全部内容,更多相关Python内容请搜索靠谱客的其他文章。
本图文内容来源于网友提供,作为学习参考使用,或来自网络收集整理,版权属于原作者所有。


发表评论 取消回复