(本专栏是我的慕课学习笔记,后续发现不足之处会更新)
首先是matplotlib最基础的操作的应用,有一个大概的认识:
import numpy as np
import matplotlib.pyplot as plt

x = np.linspace(-np.pi, np.pi, 256, endpoint=True)  # 横轴,-pi到pi之间,256个点
c = np.cos(x)    # c代表cos
plt.figure(1)
plt.plot(x, c)  # 变量分别是自变量和因变量(必须)
plt.show()  # 显示图形
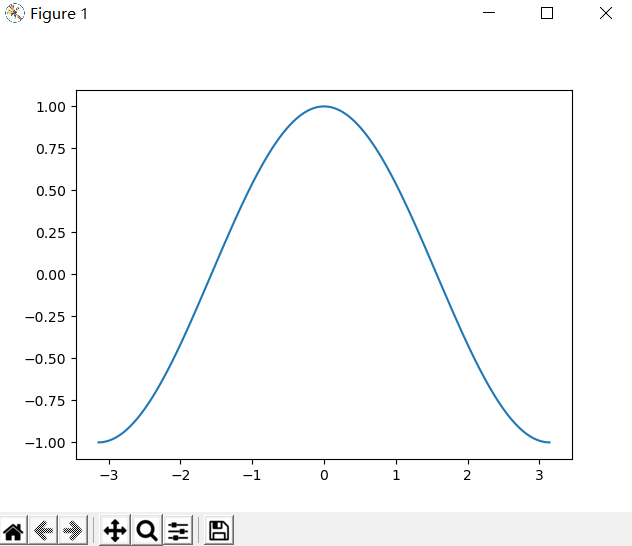
运行效果:

下面对该图表加以改进:
import numpy as np
import matplotlib.pyplot as plt

x = np.linspace(-np.pi, np.pi, 256, endpoint=True)  # 横轴,-pi到pi之间,256个点
c, s = np.cos(x), np.sin(x)     # c代表cos,s代表sin
plt.figure('这是一个cos')   # 程序框标题
plt.plot(x, c, color='red', linewidth=3.0, label='y=sinx')  # 变量分别是自变量和因变量(必须)
plt.plot(x, s, color='blue', linestyle='-.', label='y=cosx')    # 后续变量指定颜色,线宽(非必须)
plt.legend(loc='upper left', fontsize=16)    # 设置上面两个label的显示位置
# linestyle有4种:①'-',实线 ②'--',虚线 ③'-.',线点交替 ④':',点线
plt.rcParams['font.sans-serif']=['FangSong']
plt.rcParams['axes.unicode_minus'] = False  # 如果没有这两行,图表标题中的中文无法显示
plt.title("cos和sin在(-pi,pi)中的表示", fontsize=16)

ax = plt.gca()  # 轴的编辑器
ax.spines['right'].set_color('None')    # 将右边界线隐藏
ax.spines['top'].set_color('None')      # 将上边界线隐藏
ax.spines['left'].set_position(('data', 0))   # 将左边界设为自变量为0处
ax.spines['bottom'].set_position(('data', 0))   # 将下边界设为自变量为0处(即相交点为(0,0))

ax.xaxis.set_ticks_position("bottom")   # 横坐标的字在轴的下边
ax.yaxis.set_ticks_position("left")     # 纵坐标的字在轴的左边
plt.xticks([-np.pi, -np.pi/2, 0, np.pi/2, np.pi],   # Latex语法
           [r'$-pi$', r'$-pi/2$', '$0$', r'$+pi/2$', r'$+pi$'])
plt.yticks(np.linspace(-1, 1, 5, endpoint=True))    # -1到1,标5个点
for label in ax.get_xticklabels() + ax.get_yticklabels():
    label.set_fontsize(16)
    label.set_bbox(dict(facecolor='red', edgecolor='None', alpha=0.08))  # 对坐标旁边的字进行设置

plt.grid()      # 网格线
plt.axis([-3.5, 3.5, -1.2, 1.2])    # 显示范围
plt.plot([1, 1], [0, np.cos(1)], linestyle='--')    # (1,0)到(1,cos1)之间加一条虚线
# 注释内容,字体大小,注释坐标(原坐标+偏移量),箭头类型
plt.annotate('cos1', xy=(1, np.cos(1)), fontsize=16, xytext=(+10, +30),
             textcoords='offset points', arrowprops=dict(arrowstyle='->', connectionstyle='arc3'))
plt.show()  # 显示图形
运行效果:

氷鸢鸢鸢
2020.8.5
最后
以上就是鳗鱼荷花最近收集整理的关于Python数据分析——matplotlib(绘图)的全部内容,更多相关Python数据分析——matplotlib(绘图)内容请搜索靠谱客的其他文章。
本图文内容来源于网友提供,作为学习参考使用,或来自网络收集整理,版权属于原作者所有。


发表评论 取消回复