/* eslint-disable no-param-reassign */
import * as d3 from 'd3';
export default function pieChart(id, dataset) {
const width = 400;
const height = 400;
const fontsize = 14;
const svg = d3
.select(id)
.append('svg')
.attr('width', width)
.attr('height', height);
const pie = d3.pie().value(d => d[1]);
// dataset为转换前的数据 piedata为转换后的数据
const piedata = pie(dataset);
const outerRadius = width / 3;
const innerRadius = 0; // 内半径和外半径
// 创建弧生成器
const arc = d3
.arc()
.innerRadius(innerRadius)
.outerRadius(outerRadius);
const color = d3.scaleOrdinal(d3.schemeCategory10);
// 添加对应数目的弧组
const arcs = svg
.selectAll('g')
.data(piedata)
.enter()
.append('g')
.attr('transform', `translate(${width / 2},${height / 2})`);
// 添加弧的路径元素
arcs
.append('path')
.attr('fill', function(d, i) {
return color(i);
})
.attr('d', function(d) {
return arc(d); // 使用弧生成器获取路径
});
// 添加弧内的文字
arcs
.append('text')
.attr('transform', function(d) {
const x = arc.centroid(d)[0] * 1.4; // 文字的x坐标
const y = arc.centroid(d)[1] * 1.4;
return `translate(${x},${y})`;
})
.attr('text-anchor', 'middle')
.text(d => {
// 计算市场份额的百分比
const percent =
(Number(d.value) /
d3.sum(dataset, a => {
return a[1];
})) *
100;
// 保留一位小数点 末尾加一个百分号返回
return `${percent.toFixed(1)}%`;
});
// 添加连接弧外文字的直线元素
arcs
.append('line')
.attr('stroke', 'black')
.attr('x1', d => {
return arc.centroid(d)[0] * 2;
})
.attr('y1', d => {
return arc.centroid(d)[1] * 2;
})
.attr('x2', d => {
return arc.centroid(d)[0] * 2.2;
})
.attr('y2', d => {
return arc.centroid(d)[1] * 2.2;
});
arcs
.append('line')
.style('stroke', 'black')
.each(d => {
d.textLine = {
x1: 0,
y1: 0,
x2: 0,
y2: 0,
};
})
.attr('x1', d => {
d.textLine.x1 = arc.centroid(d)[0] * 2.2;
return d.textLine.x1;
})
.attr('y1', d => {
d.textLine.y1 = arc.centroid(d)[1] * 2.2;
return d.textLine.y1;
})
.attr('x2', d => {
// console.log("d.data[0]: "+d.data[0]);//产商名
const strLen = getPixelLength(d.data[0], fontsize) * 1.5;
const bx = arc.centroid(d)[0] * 2.2;
d.textLine.x2 = bx >= 0 ? bx + strLen : bx - strLen;
return d.textLine.x2;
})
.attr('y2', d => {
d.textLine.y2 = arc.centroid(d)[1] * 2.2;
return d.textLine.y2;
});
arcs
.append('text')
.attr('transform', function(d) {
let x = 0;
let y = 0;
x = (d.textLine.x1 + d.textLine.x2) / 2;
y = d.textLine.y1;
y = y > 0 ? y + fontsize * 1.1 : y - fontsize * 0.4;
return `translate(${x},${y})`;
})
.style('text-anchor', 'middle')
.style('font-size', fontsize)
.text(function(d) {
return d.data[0];
});
// 添加一个提示框
const tooltip = d3
.select(id)
.append('div')
.attr('class', 'tooltip')
.style('position', 'absolute')
.style('background-color', '#fff')
.style('opacity', 0);
// 添加提示框
arcs
.on('mouseover', function(d, i) {
tooltip
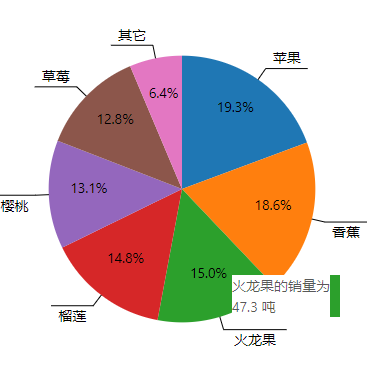
.html(`${d.data[0]}的销量为<br />${d.data[1]} 吨`)
.style('left', `${d3.event.pageX}px`)
.style('top', `${d3.event.pageY + 20}px`)
.style('opacity', 1.0)
.style('box-shadow', `10px 0px 0px${color(i)}`); // 在提示框后添加阴影
})
.on('mousemove', () => {
tooltip.style('left', `${d3.event.pageX}px`).style('top', `${d3.event.pageY + 20}px`);
})
.on('mouseout', () => {
// 鼠标移除 透明度设为0
tooltip.style('opacity', 0.0);
});
}
function getPixelLength(str, fontsize) {
let curLen = 0;
for (let i = 0; i < str.length; i += 1) {
const code = str.charCodeAt(i);
const pixelLen = code > 255 ? fontsize : fontsize / 2;
curLen += pixelLen;
}
return curLen;
}
最后
以上就是柔弱鸭子最近收集整理的关于D3.js v5.0 饼图与环形图(一)的全部内容,更多相关D3.js内容请搜索靠谱客的其他文章。
本图文内容来源于网友提供,作为学习参考使用,或来自网络收集整理,版权属于原作者所有。


发表评论 取消回复