1.概述
图像分割是将一幅图像分割成有意义区域的过程。区域可以是图像的前景与背景或 图像中一些单独的对象。这些区域可以利用一些诸如颜色、边界或近邻相似性等特 征进行构建。本章中,我们将看到一些不同的分割技术。
2. GraphCut 图割
图(graph)是由若干节点(有时也称顶点)和连接节点的边构成的集合。如图,为用 python-graph 工具包创建的一个简单有向图。边可以是有向的(图 9-1 中用箭头示出)或无向的,并且 这些可能有与它们相关联的权重。

*我们在图割例子中将采用 python-graph 工具包
图割图像分割的思想是用图来表示图像,并对图进行划分以使割代价 Ecut 最小。在 用图表示图像时,增加两个额外的节点,即源点和汇点;并仅考虑那些将源点和汇 点分开的割。图割 C(C 是图中所有边的集合)的“代价”函数定义为所有割的边的权重求合相加: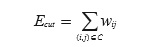
w是图中节点 i 到节点 j 的边(i,j)的权重,并且是对割 C 所有的边进行求和。
python-graph 工具包计算一幅较小的图 1 的最大流 / 最小割的示例:
from pygraph.classes.digraph import digraph
from pygraph.algorithms.minmax import maximum_flow
gr = digraph()
gr.add_nodes([0,1,2,3])
gr.add_edge((0,1), wt=4)
gr.add_edge((1,2), wt=3)
gr.add_edge((2,3), wt=5)
gr.add_edge((0,2), wt=3)
gr.add_edge((1,3), wt=4)
flows,cuts = maximum_flow(gr, 0, 3)
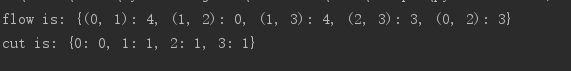
print ('flow is:' , flows)
print ('cut is:' , cuts)
运算结果为
3.从图像创建图
给定一个邻域结构,我们可以利用图像像素作为节点定义一个图。一个四邻域 (4-neighborhood)指一个像素与其正上方、正下方、左边、右边的像素直接相连 1。
除了像素节点外,我们还需要两个特定的节点——“源”点和“汇”点,来分别代表图像的前景和背景。利用一个简单的模型将所有像素与源点、汇点连接起来。
创建一个图的步骤:
每个像素节点都有一个从源点的传入边;
每个像素节点都有一个到汇点的传出边;
每个像素节点都有一条传入边和传出边连接到它的近邻。
代码示例
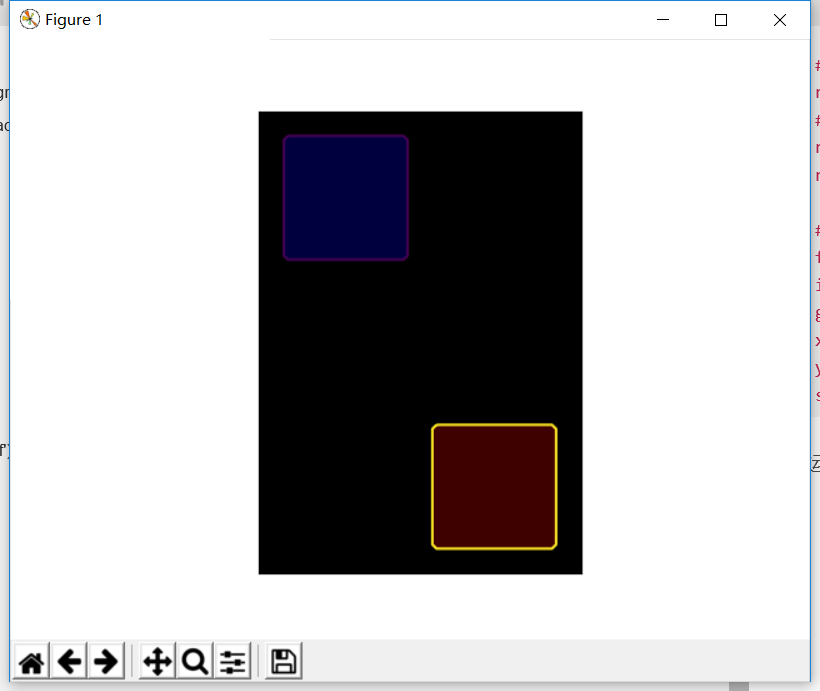
读取一幅图像, 从图像的两个矩形区域估算出类概率,然后创建一个图
# -*- coding: utf-8 -*-
from scipy.misc import imresize
from PCV.tools import graphcut
from PIL import Image
from numpy import *
from pylab import *
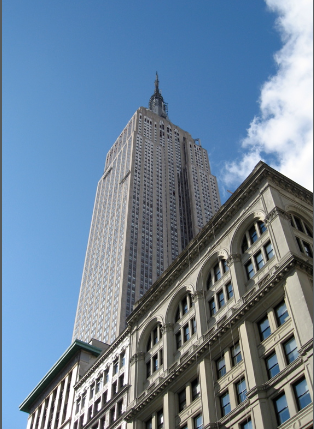
im = array(Image.open("empire.jpg"))
im = imresize(im, 0.07)
size = im.shape[:2]
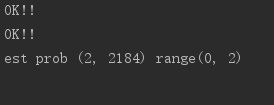
print ("OK!!")
# add two rectangular training regions
labels = zeros(size)
labels[3:18, 3:18] = -1
labels[-18:-3, -18:-3] = 1
print ("OK!!")
# create graph
g = graphcut.build_bayes_graph(im, labels, kappa=1)
# cut the graph
res = graphcut.cut_graph(g, size)
print ("OK!!")
figure()
graphcut.show_labeling(im, labels)
figure()
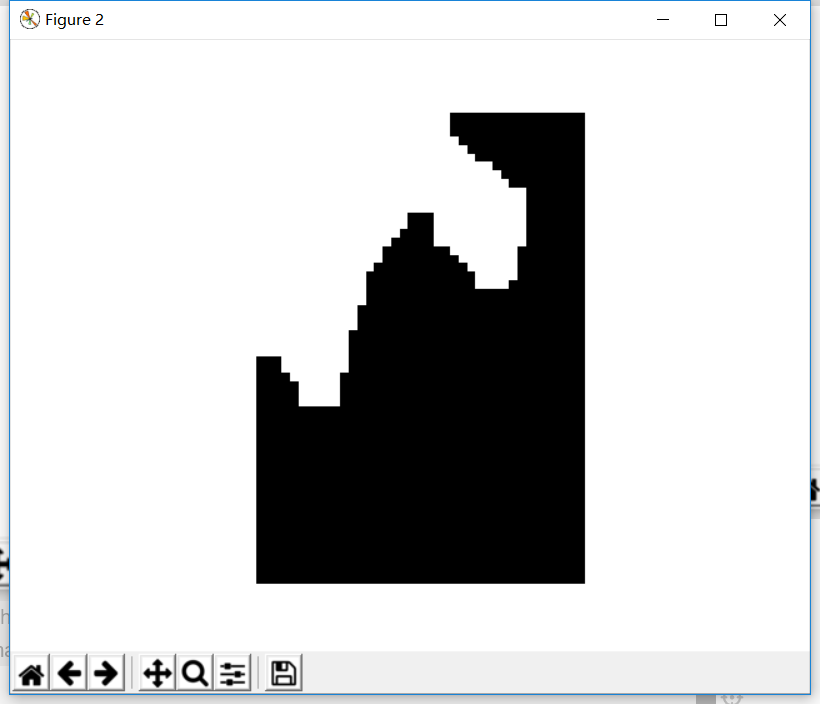
imshow(res)
gray()
axis('off')
show()
运行结果:
下面这个函数可以计算最小割并将 输出结果重新格式化为一个带像素标记的二值图像:
def create_msr_labels(m, lasso=False):
    """ Create label matrix for training from
    user annotations. """
    labels = zeros(im.shape[:2])
    # background
    labels[m == 0] = -1
    labels[m == 64] = -1
    # foreground
    if lasso:
        labels[m == 255] = 1
    else:
        labels[m == 128] = 1
    return labels

# load image and annotation map
im = array(Image.open('empire.jpg'))
m = array(Image.open('empire.bmp'))
# resize
scale = 0.1
im = imresize(im, scale, interp='bilinear')
m = imresize(m, scale, interp='nearest')
# create training labels
labels = create_msr_labels(m, False)
# build graph using annotations
g = graphcut.build_bayes_graph(im, labels, kappa=2)

# cut graph
res = graphcut.cut_graph(g, im.shape[:2])
# remove parts in background
res[m == 0] = 1
res[m == 64] = 1

# plot the result
figure()
imshow(res)
gray()
xticks([])
yticks([])
savefig('labelplot.pdf')
原图:
运行结果:
运行时可能出现的问题:
import pygraph包内的方法时,python2和python3语法有差别。
如 Exception,e 在python3中应为(Exception)
符号“-”用“^”替代
最后
以上就是魁梧缘分最近收集整理的关于计算机视觉学习 图像分割的全部内容,更多相关计算机视觉学习内容请搜索靠谱客的其他文章。


发表评论 取消回复