我是靠谱客的博主 开朗故事,这篇文章主要介绍Hystrix 监控可视化页面——Dashboard 流监控1.什么是Dashboard 2.如何配置Dashboard——监控服务3.被监控服务配置 4.监控效果图,现在分享给大家,希望可以做个参考。
1.什么是Dashboard
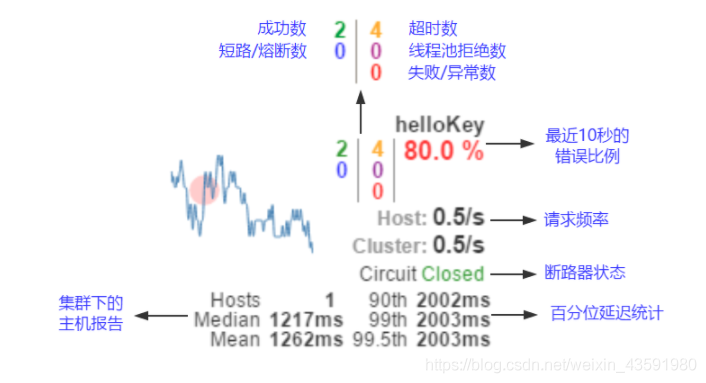
Hystrix-dashboard 是一款针对 Hystrix 进行实时监控的工具页面,通过 Hystrix Dashboard 我们可以在直观地看到各 Hystrix Command 的请求响应时间, 请求成功率等数据。
2.如何配置Dashboard——监控服务
1.导入依赖
<!--Hystrix依赖-->
<dependency>
    <groupId>org.springframework.cloud</groupId>
    <artifactId>spring-cloud-starter-hystrix</artifactId>
    <version>1.4.6.RELEASE</version>
</dependency>
<!--dashboard依赖-->
<dependency>
    <groupId>org.springframework.cloud</groupId>
    <artifactId>spring-cloud-starter-hystrix-dashboard</artifactId>
    <version>1.4.6.RELEASE</version>
</dependency>
2配置文件配置端口号
server:
	prot: 8899   # 端口号可以自行配置  只要是和别的服务的端口号不冲突就好
3.启动服务------Dashboard 作为一个独立的服务存在
@SpringBootApplication
// 开启Dashboard
@EnableHystrixDashboard
public class DeptConsumerDashboard {
    public static void main(String[] args) {
        SpringApplication.run(DeptConsumerDashboard.class,args);
    }
}
3.被监控服务配置
1.添加监控信息依赖
添加监控注解
<!--actuator 完善监控信息 -->
<dependency>
    <groupId>org.springframework.boot</groupId>
    <artifactId>spring-boot-starter-actuator</artifactId>
</dependency>
2.在被监控的服务启动类上添加一个servlet
//增加一个Servlet
    @Bean
    public ServletRegistrationBean hystrixMetricsStreamServlet(){
        ServletRegistrationBean registrationBean = new ServletRegistrationBean(new HystrixMetricsStreamServlet());
        //参数固定写法
        registrationBean.addUrlMappings("/actuator/hystrix.stream");
        return registrationBean;
    }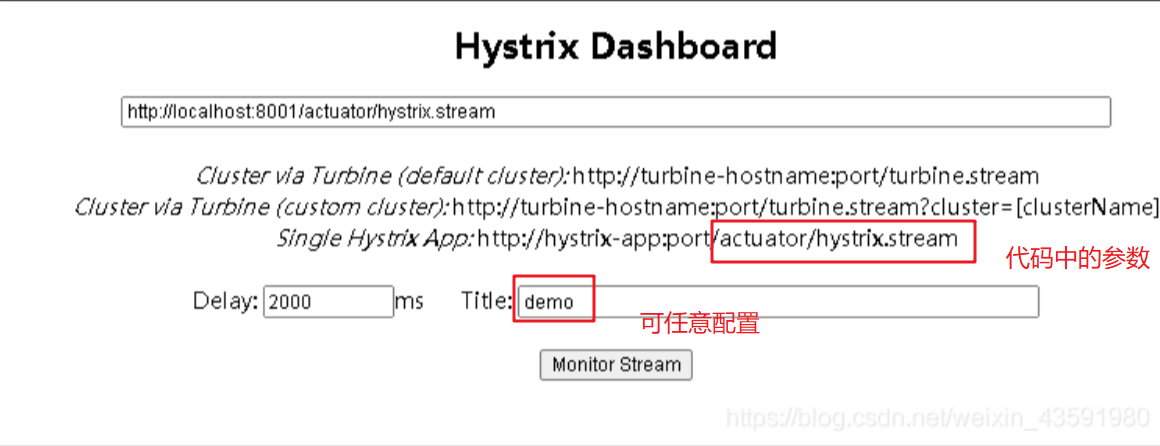
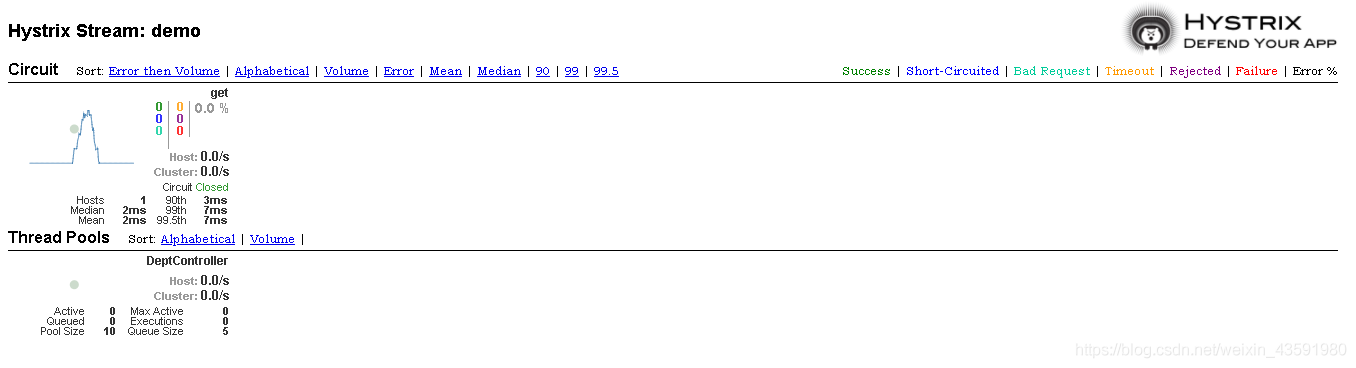
4.监控效果图
最后
以上就是开朗故事最近收集整理的关于Hystrix 监控可视化页面——Dashboard 流监控1.什么是Dashboard 2.如何配置Dashboard——监控服务3.被监控服务配置 4.监控效果图的全部内容,更多相关Hystrix内容请搜索靠谱客的其他文章。
本图文内容来源于网友提供,作为学习参考使用,或来自网络收集整理,版权属于原作者所有。


发表评论 取消回复